The Nifty found support on its 200-day EMA (exponential moving average - 18,835) and bounced back from the red on the closing day last week. The Nifty recovered 321-odd points from the recent swing low of 18,837. Recent pullback in the Nifty has been with relatively lower turnover. Despite the recovery, Nifty is still placed below its nearest moving average of 5 DEMA (19,151).
Last week, the Nifty breached the crucial swing low support of 19,333 and 19,230. The index confirmed lower tops and lower bottoms on the daily charts and has reached below its 20, 50 and 100-day EMA, which signals the medium term down trend.
In the current pullback, previous support levels of 19,230 and 19,333 are expected to interchange their roles as a resistance for Nifty. Indicators and oscillators like RSI (relative strength index) and MACD (moving average convergence divergence) have turned bearish on the Nifty weekly chart.
Number of stocks above the 200-day SMA has begun coming down after a long time for the NSE500, which indicates weakening breadth of the market.
Looking at the positional technical setup, it would be advisable to lighten long commitments in the resistance zone of 19,230-19,333. Below 18,837, the Nifty could slide towards the next support of 18,525, which happens to be the 50 percent retracement support of the entire swing seen from 16,828 (March 2023 bottom) to 20,222 (September 2023 top and all-time high).
Here are three buy calls for short term:
GNFC: Buy | LTP: Rs 684 | Stop-Loss: Rs 629 | Target: Rs 750 | Return: 10 percent
Gujarat Narmada Valley Fertilizers and Chemicals (GNFC) price has been forming higher tops and higher bottoms on the daily chart. Primary trend of the stock is bullish as it is placed above all important moving averages.
Indicators and oscillators have been showing bullish trend for the stock. In the October series, the stock has seen long build up in the derivative segment, which confirms the uptrend.

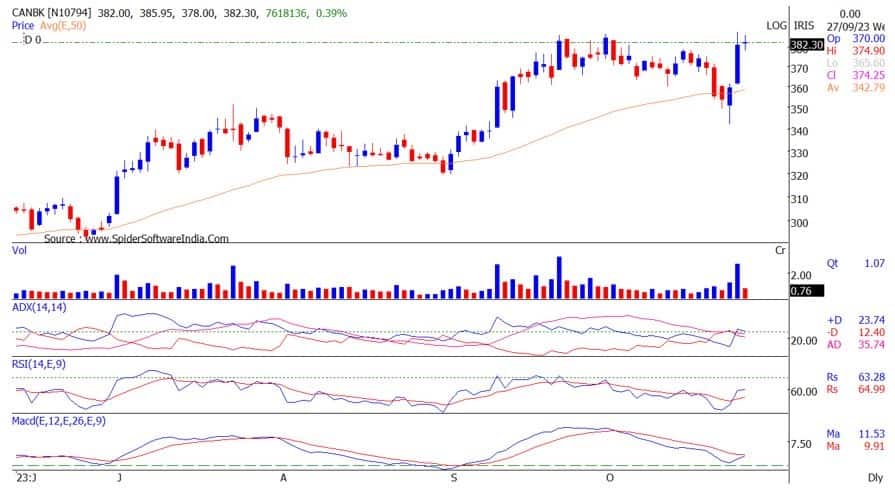
Canara Bank: Buy | LTP: Rs 382 | Stop-Loss: Rs 361 | Target: Rs 405 | Return: 6 percent
The stock price has registered fresh 52-week high of Rs 387.80 with jump in volumes. The stock has remained resilient in the recent market weakness. It has broken out from Flag pattern on the weekly chart, which indicates continuation of an primary uptrend.
Birlasoft: Buy | LTP: Rs 542 | Stop-Loss: Rs 509 | Target: Rs 590 | Return: 9 percent
The stock price has broken out from the Bullish Flag pattern on the daily chart. Primary trend of the stock is bullish as it has been forming higher tops and higher bottoms on the weekly charts.
Indicators and oscillators have also been showing strength on daily and weekly time frame.

Disclaimer: The views and investment tips expressed by investment experts on Moneycontrol.com are their own and not those of the website or its management. Moneycontrol.com advises users to check with certified experts before taking any investment decisions.

Discover the latest Business News, Sensex, and Nifty updates. Obtain Personal Finance insights, tax queries, and expert opinions on Moneycontrol or download the Moneycontrol App to stay updated!
Find the best of Al News in one place, specially curated for you every weekend.
Stay on top of the latest tech trends and biggest startup news.