On April 24, the Nifty broke out from the flag pattern on the daily chart, which indicates the resumption of an uptrend. However, last weekly candle was ended up with a bearish engulfing formation, which will be negated if Nifty surpasses 17,863 level.
Last week, the Nifty reached near the crucial support of 17,500, derived from 50-day and 200-day EMA (exponential moving average). Fibonacci retracements of 38.2 percent and 50 percent of the entire upswing seen from 16,913 (low of March 28) to 17,883 (high of April 17) are placed at 17.500 and 17.388. So trend of the Nifty index is expected to remain bullish unless it breaks 17,388 on closing basis.
India VIX, which measures the volatility that traders expect over the next thirty days in the Nifty, has reached at the historical lows of 11.62, which indicates extremal low volatility expected in the Nifty. A lower VIX signifies low volatility and a stable range for the asset price. India VIX at multi-year low is good for the market, as India VIX has a negative correlation with Nifty.
In general, Lower India VIX = Lower Risk of Falling.
Considering the technical evidence discussed above, we believe that market can continue to be stock and sector specific. Any level below 17,388 would reverse the trend from bullish to bearish. Any level above 17,900 would be considered as resumption of medium term uptrend.
Here are three buy calls for next 2-3 weeks:
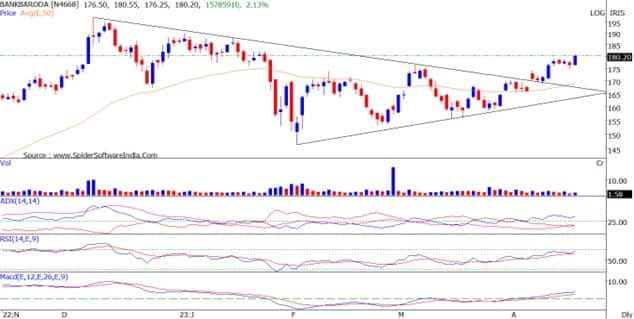
Bank of Baroda: Buy | LTP: Rs 180 | Stop-Loss: Rs 167 | Target: Rs 202 | Return: 12 percent
The stock price is trading within the big symmetrical triangle, which adjoins major swing highs and lows since December 2022. The stock is on the verge of breaking out from the symmetrical triangle. The chances of bullish breakout is higher as stock has been forming higher tops and higher bottoms on daily chart.
Primary trend of the PSU bank index is bullish, as it has been holding above its 200-day EMA. Indicators and oscillators like RSI (relative strength index), MACD (moving average convergence divergence) and DMI (directional movement index) have turned bullish on daily charts.
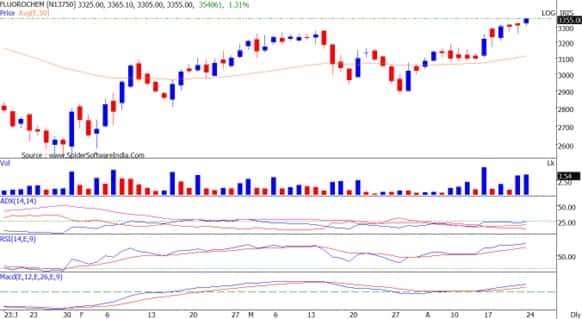
Gujarat Fluorochemicals: Buy | LTP: Rs 3,359 | Stop-Loss: Rs 3,175 | Targets: Rs 3,575-3,700 | Return: 10 percent
The stock price has broken out from bullish Inverted Head and Shoulder pattern on the weekly chart. Stock has also confirmed higher top preceded by higher bottom on the weekly chart.
The stock price rise is accompanied with rise in volumes. It is placed above all important moving averages, which indicates bullish trend on all time frames.
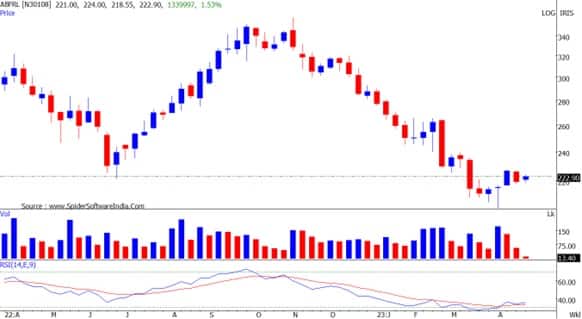
Aditya Birla Fashion & Retail: Buy | LTP: Rs 223 | Stop-Loss: Rs 210 | Targets: Rs 242-255 | Return: 14 percent
On week ended April 6, 2023, the stock formed “Long Legged Doji” candlestick pattern on the weekly chart. the stock has formed this reversal pattern after healthy fall from 6-month price.
The weekly RSI has exited the oversold zone, which also adds the strength in the trend reversal. It has surpassed 20-day EMA resistance and has been sustaining above it.
Disclaimer: The views and investment tips expressed by investment experts on Moneycontrol.com are their own and not those of the website or its management. Moneycontrol.com advises users to check with certified experts before taking any investment decisions.

Discover the latest Business News, Sensex, and Nifty updates. Obtain Personal Finance insights, tax queries, and expert opinions on Moneycontrol or download the Moneycontrol App to stay updated!
Find the best of Al News in one place, specially curated for you every weekend.
Stay on top of the latest tech trends and biggest startup news.