


By Ashutosh Joshi, Abhishek Vishnoi and Akshay Chinchalkar
The sharp rebound in Indian stocks, driven by an inflow of foreign cash and expectations for continued economic growth amid a worsening global macro backdrop, may be running out of steam.
The nation’s key stocks gauges have catapulted back to near-record levels, with the S&P BSE Sensex up about 12% this quarter, among the world’s best performers. The rapid ascent has made some investors uncomfortable, and a number of indicators are flashing warning signs.
“The current momentum in the equity markets can sustain, but we would advise investors to raise some cash at the current levels,” said Naveen Kulkarni, chief investment officer of Axis Securities Ltd.’s portfolio business. He suggested investors can re-deploy funds in case of a market correction.
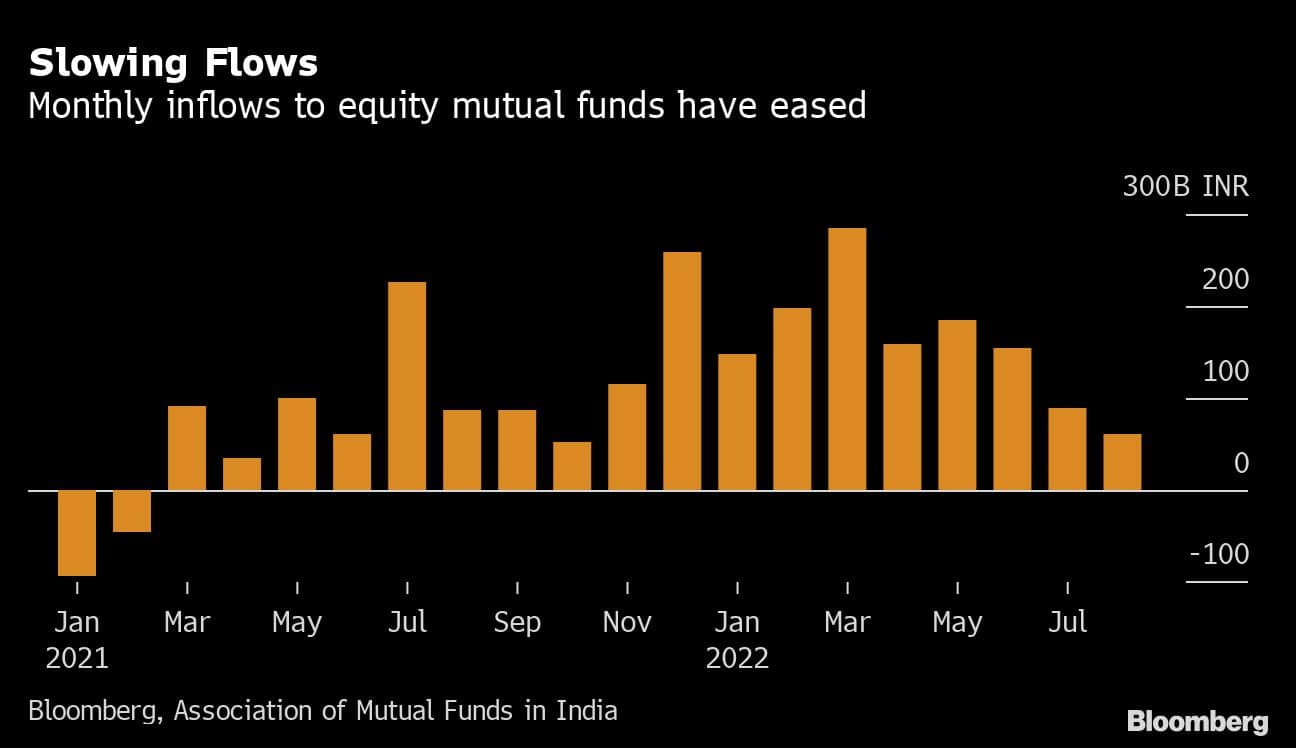
Here are four charts that spell trouble for India’s stock rally:Monthly inflows to domestic mutual funds have been slowing recently. In August, investors put a net 61 billion rupees ($765 million) into equity funds, the lowest amount since October.
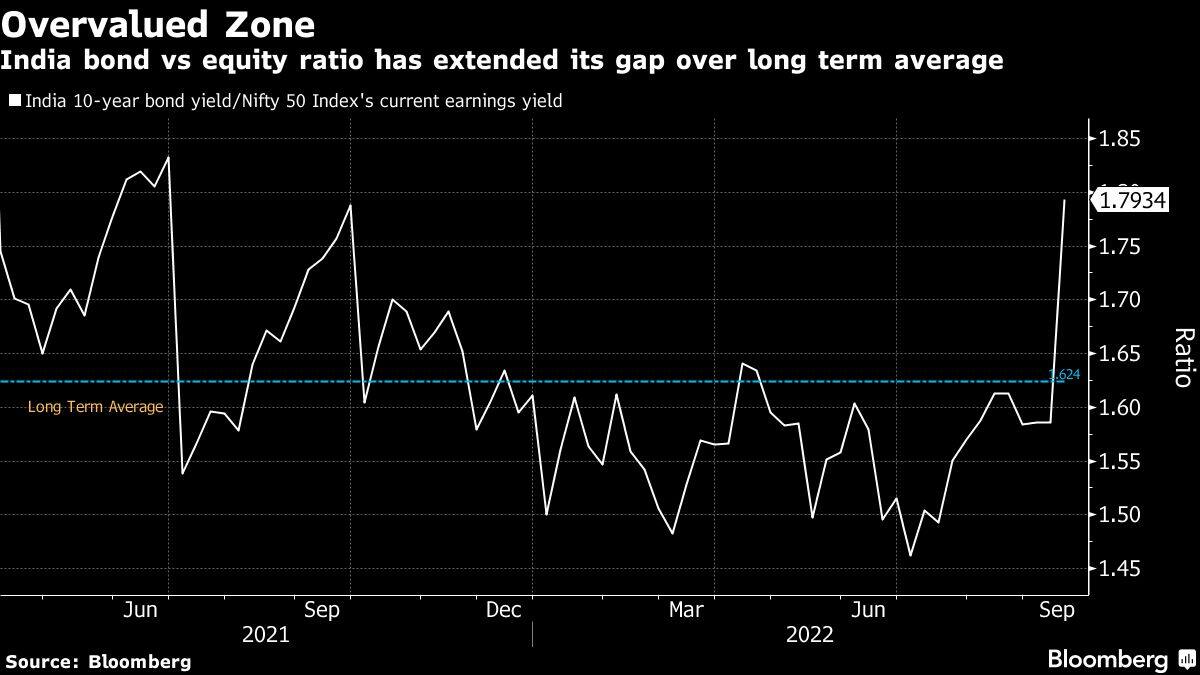
Long-term Indian government bond yields have rebounded recently as global central banks gear up for bigger rate hikes to tackle inflation. At the same time, corporate earnings per share have fallen even as stock prices continue to rise, making equity relatively unattractive versus bonds.
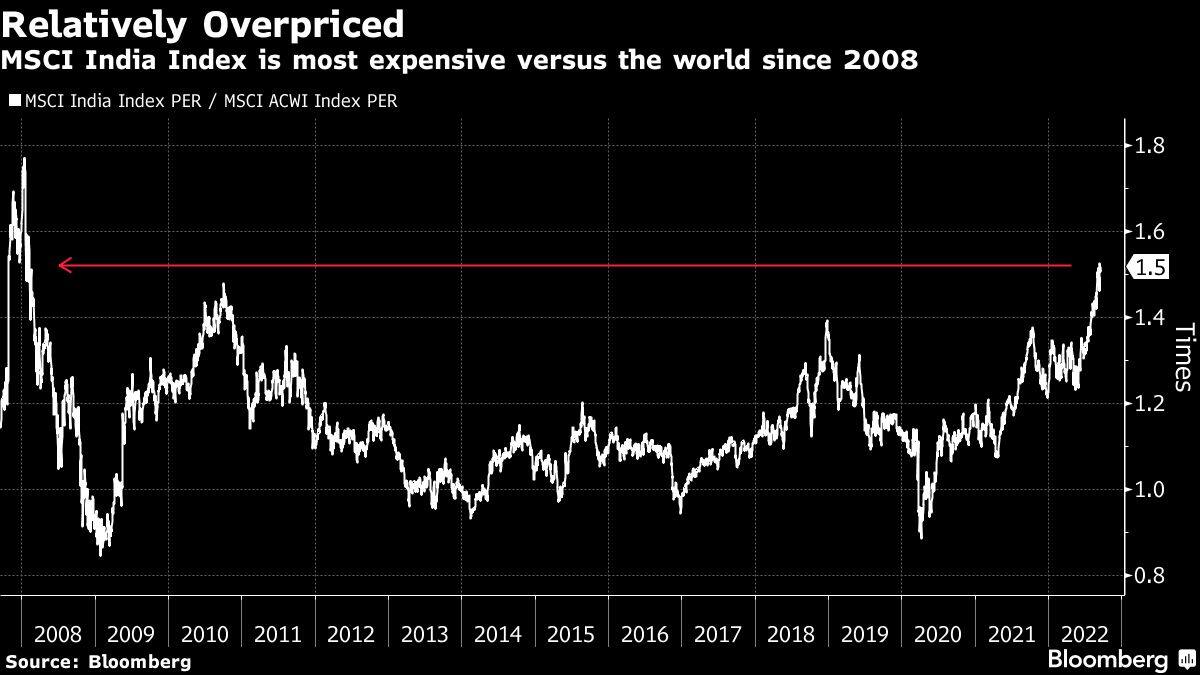
The MSCI India Index’s price-to-earnings ratio is at a 50% premium to that of the MSCI World index, a level last seen in the days of global financial crisis, according to data compiled by Bloomberg. That shows that a lot of the positives have already been priced in at a time when aggressive monetary tightening is bringing major economies to the brink of recession.
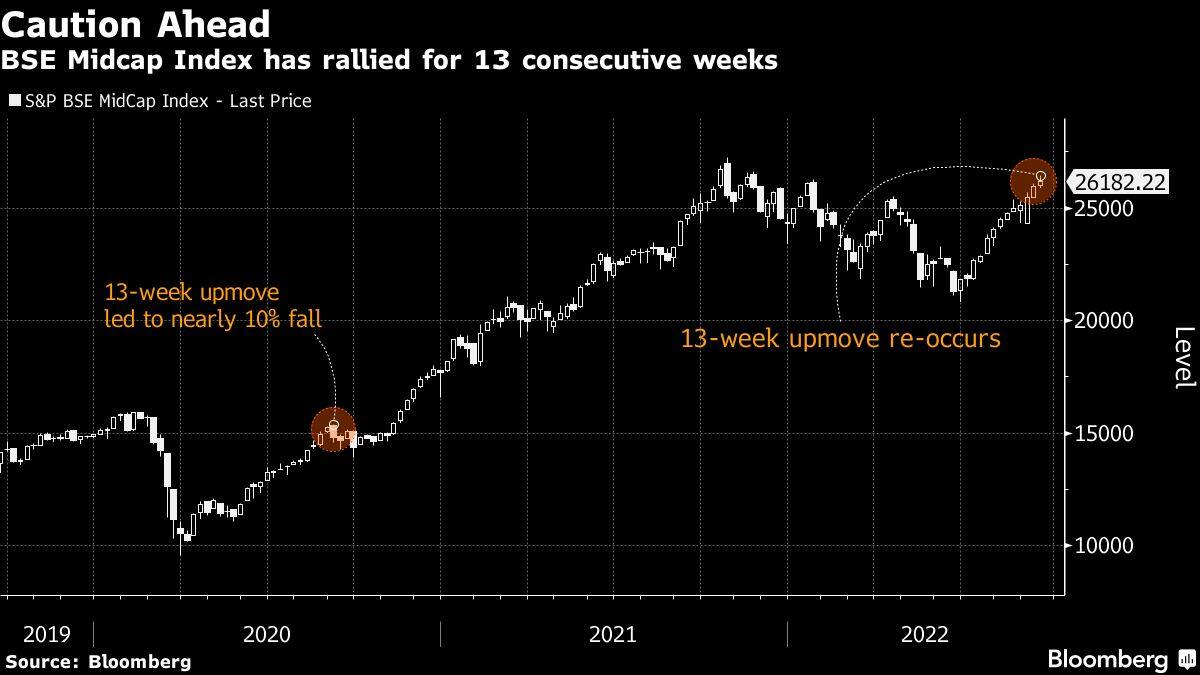
The BSE Midcap index has gained for 13 consecutive weeks, matching a streak in August 2020 amid the recovery from the pandemic selloff. In that previous instance, the index proceeded to slide nearly 10% from its peak over the following four weeks before resuming its climb.
“India has strongly outperformed the world,” said Deepak Jasani, head of research at HDFC Securities Ltd. “It can’t keep going one-way up, some cool-off is likely.”
Discover the latest Business News, Sensex, and Nifty updates. Obtain Personal Finance insights, tax queries, and expert opinions on Moneycontrol or download the Moneycontrol App to stay updated!
Find the best of Al News in one place, specially curated for you every weekend.
Stay on top of the latest tech trends and biggest startup news.


