
Shabbir Kayyumi
Narnolia Financial Advisors
Basics of Technical Analysis: Part 3
What is Support & Resistance?
Support and resistance points are important price levels on technical charts from where price trends are expected to stop and reverse.
A support level is a level where the price tends to find support as it falls. This means that the price is more likely to "bounce" off this level rather than break through it. However, once the price has breached this level, by an amount exceeding some noise, it is likely to continue falling until meeting another support level.
A resistance level is the opposite of a support level. It is where the price tends to find resistance as it rises. Again, this means that the price is more likely retrace from this level rather than break through it. However, once the price has breached this level, it is likely to continue rising until meeting another resistance level.
Four Major ways to identify support & resistance
1) Swing High & Swing Low
When you track market swings; you are following the turning points of price action. Each turning point is the result of the market being supported or resisted. Hence, observing market swings is fundamental to identifying support and resistance levels.
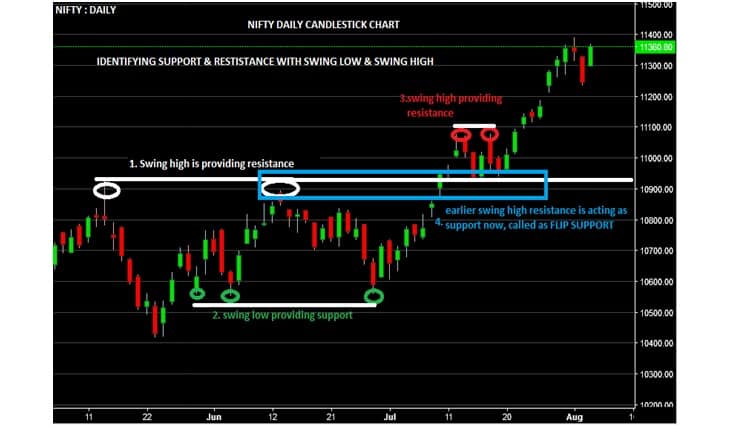
Figure 1 – ‘Swing High & Swing Low acting as Support & Resistance’ Example of NIFTY
Observations from above Nifty Chart:-
1) Point 1 on chart indicates previous swing high provides resistance in future.
2) Point 2 on chart suggests, swing low can act as a suport in coming days.
3) Point3 talks about resistance provided by swing high.
4) Point 4 shows how swing pivots acted as resistance before flipping into a support level.
On historical charts, you can mark out swings that perform well as support and resistance. To ensure consistency, you must practice regularly marking market swings and strong support & resistance zones.
2) Moving Averages
Moving average is one of the most important technical analysis tools. The most common type of moving average is simple moving average (SMA). It is computed by taking average of all the past closing prices over a specified time periods. Moving averages are used by many traders for identifying support and resistance. As you can see from the chart below, a moving average is a constantly changing line that smoothens out past price data, which is also allowing the trader to identify support and resistance.

Figure 2 – ‘200 Week SMA acting as Support & Resistance’ Example of NIFTY
Looking at above Nifty chart, one can easily observe, how benchmark index has taken support from 200 Week simple moving average (200 WSMA) marked with red arrow. However moving average can provide resistance too, and can be useful taking prudent decision while profit booking.
3) Price Gaps
Price gaps are also effective support and resistance zones. Although the market has moved past them, no actual trading has taken place within the gap zone. Hence, traders who intended to buy or sell within the gap range missed their chance to do so. And they are now waiting for the market to give them a second chance.
When the market returns to the gap, they will grab that second chance and send in their trading orders. This behavior creates the potential for support zone around gap area.
Figure 3 – ‘Price Gap acting as support zone’ Example of NIFTY
In the example above, Nifty has taken support from bullish gap, around 11080 levels and 11230 levels recently. Here gap is acting as a strong support and pushed prices upwards, however one should notice that not all gaps are unfilled & provide strong support, combining it with other support & resistance zones would definitely add the strength.
4) High Volume Zone
Trading volume is a powerful indicator of market interest. In practice, one should look for price bars (candlesticks) with extremely high volume and use it to understand price behavior in that zone in future.
Definition of high volume can be set in some simple manner like- it should be greater than 5-6 times of average volume of last 5 days. However a big candle/volume spike can also be easily noticed on the volume chart.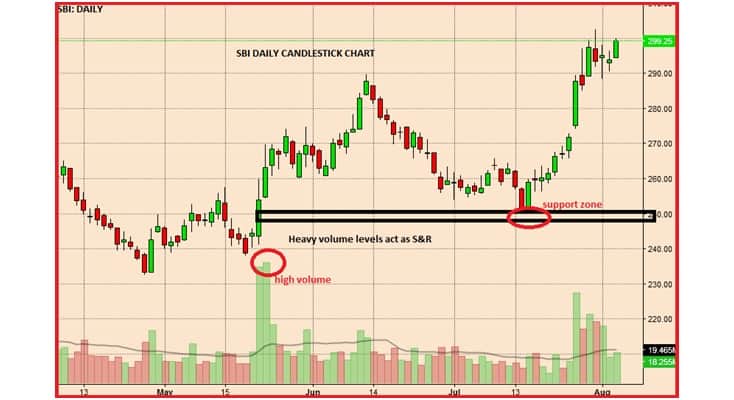
Figure4 – ‘High Volume Candle acting as support zone’ Example of SBI
Looking at above SBI chart, high volume candle occurred around Rs 250 levels earlier has acted as a support in future, marked with red circle. Nevertheless high volume bar is easily visible from other bars. Whenever swing low is accompanying with high volume, it acts as a strong support. Similarly a swing high with high volume generally acts as a strong resistance.
Conclusion
Support and resistance are supply and demand manifested by price action. There are many ways to find support and resistance. But for the best results, one should concentrate on price action and volume. Finding reliable support and resistance is a crucial ability of a professional trader. Swing high & swing low and the most popular moving average like 200 DMA, can be used regularly for finding crucial support and resistance zone.
Disclaimer: The author is Head - Technical & Derivative Research at Narnolia Financial Advisors Ltd. The views and investment tips expressed by investment expert on Moneycontrol.com are his own and not that of the website or its management. Moneycontrol.com advises users to check with certified experts before taking any investment decisions.

Discover the latest Business News, Sensex, and Nifty updates. Obtain Personal Finance insights, tax queries, and expert opinions on Moneycontrol or download the Moneycontrol App to stay updated!
Find the best of Al News in one place, specially curated for you every weekend.
Stay on top of the latest tech trends and biggest startup news.