


The past week in the market was characterised by a clear dominance of bullish sentiment, with little opposition from bearish forces. This upward movement resulted in a notable gain of 1.19 percent for the week ending February 16, reflecting the strength of the bullish trend.
In previous weekly analysis, we noted the rising trend in the India VIX, which is a measure of market volatility, suggesting potential uncertainties ahead. However, despite this initial indication, the VIX formed a triple top pattern during the past week, reaching a peak of 16.57 before closing near the 15 mark. This pattern formation, coupled with the decline in the VIX by the end of the week, suggests a potential shift in sentiment towards stability or even optimism. The VIX's weekly loss of -1.46 percent further reinforces this interpretation, indicating a decrease in market volatility compared to the previous week.
In analyzing the Nifty index, despite the weekly closing falling short of the all-time high of approximately 22,126.80, there are several indicators pointing towards continued bullish momentum. One such indicator is the weekly stochastic, which has shown a bullish crossover after reversing from the 60 levels. This suggests that the buying pressure is strengthening, potentially leading to further upward movement in the market during the upcoming week. Additionally, the long/short ratio, currently fluctuating between 36-40, holds significance in determining market sentiment. A steady increase in this ratio by the next week could provide additional support for the bulls, fueling further upside movement in the Nifty index.
However, it's crucial to consider the possibility of a reversal or correction in the market. If the Nifty index were to close below the 21,800 level in the upcoming week, it may indicate a weakening of bullish sentiment and could prompt a retest of the 21,500 support level.
Bank Nifty
The banking index demonstrated resilience and strength in the past week as it rebounded once again from its 200-day exponential moving average (DEMA). This rebound was significant, leading to a weekly gain of 1.64 percent, indicating a renewed interest in buying from lower levels.
Moreover, in the previous week's analysis, a bullish BAT pattern on a daily scale was identified, hinting at the potential for upward momentum. As anticipated, the Bank Nifty indeed experienced a significant surge, pumping 1,800 points from its low to high. This reaffirms the validity and effectiveness of technical analysis in identifying potential market movements.
Looking ahead, it's crucial to monitor the Bank Nifty's performance closely. The index needs to maintain the support level of 46,000 in the upcoming week to sustain its bullish momentum. If it successfully holds above this level, there's a possibility of it testing the 47,500 level, indicating further upward movement.
However, failure to maintain support at 46,000 could result in additional selling pressure, potentially pushing the Bank Nifty down towards the next support level at 45,500.
Here are three buy calls for next 2-3 weeks:
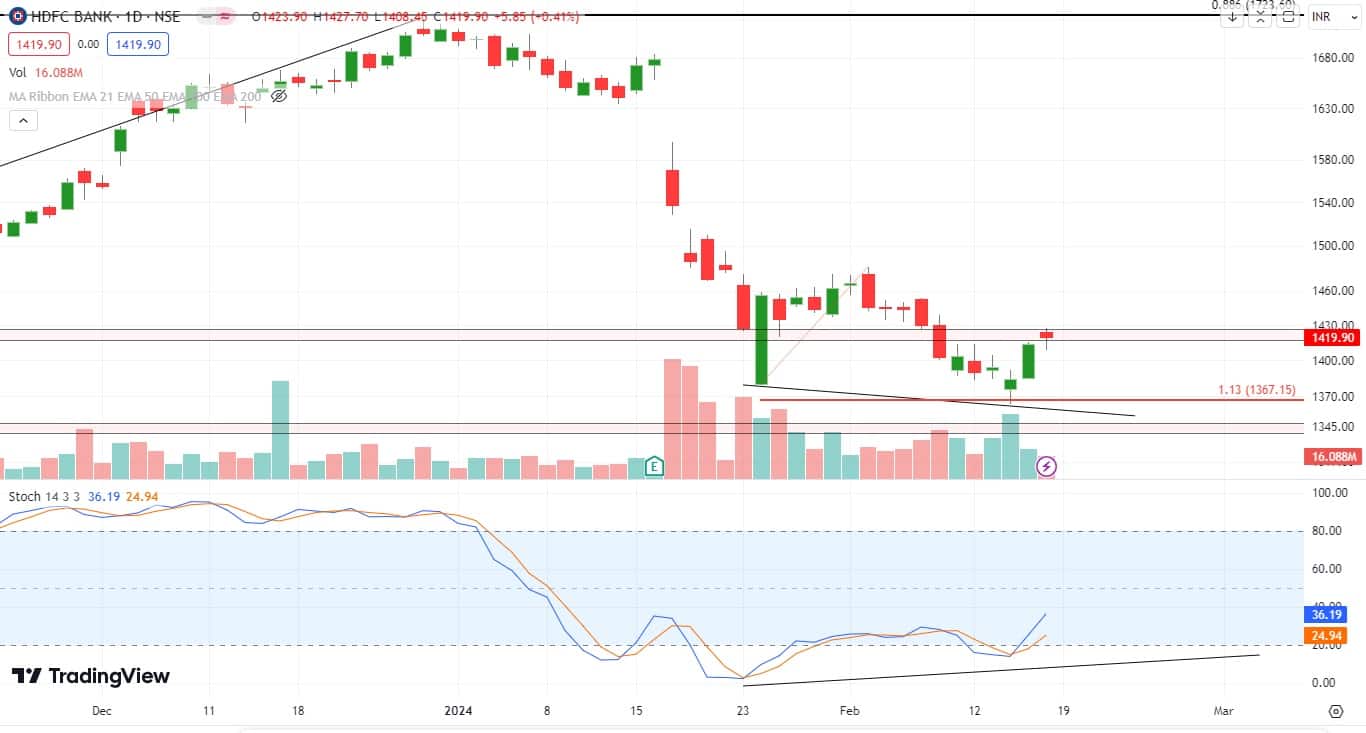
HDFC Bank: Buy | LTP: Rs 1,420 | Stop-Loss: Rs 1,368 | Target: Rs 1,500 | Return: 5.6 percent
HDFC Bank peaked at around Rs 1,721 on December 28, 2023, before declining by approximately Rs 358 (21 percent). Over the past two weeks, the stock has traded within a tight range of Rs 1,380 to Rs 1,480, indicating market indecision.
On indicator front, the daily scale stochastics indicator identified a "Regular Bull Divergence" near a 1.13 harmonic ratio (refer to the chart). This divergence suggests potential upward momentum despite recent price declines, signalling a possible bullish reversal in the near future. Thus one can add longs in the zone of Rs 1,400-1,425 for upside target of Rs 1,500 and stop-loss would be placed near Rs 1,368 on daily close basis.
MMTC: Buy | LTP: Rs 78.3 | Stop-Loss: Rs 58 | Target: Rs 110 | Return: 40 percent
Recently, MMTC has exhibited a significant technical development, notably forming an Inverse Head and Shoulders pattern on the monthly scale, particularly within the price range of Rs 65-75 levels. This pattern, characterised by three troughs with the middle one (head) lower than the others (shoulders), often signifies a bullish reversal.
Adding to the bullish sentiment is the observation on the indicator front. The Monthly Stochastic Oscillator, a momentum indicator, has reversed direction from the 50 level. Such a reversal is typically interpreted as a shift in momentum from bearish to bullish.
Combining these technical signals, we've recommended traders to initiate long positions in MMTC within the range of Rs 70-80, with a bullish target set at Rs 110. To manage risk, we've suggested implementing a stop-loss strategy, with the stop-loss set at Rs 58 on a daily closing basis.

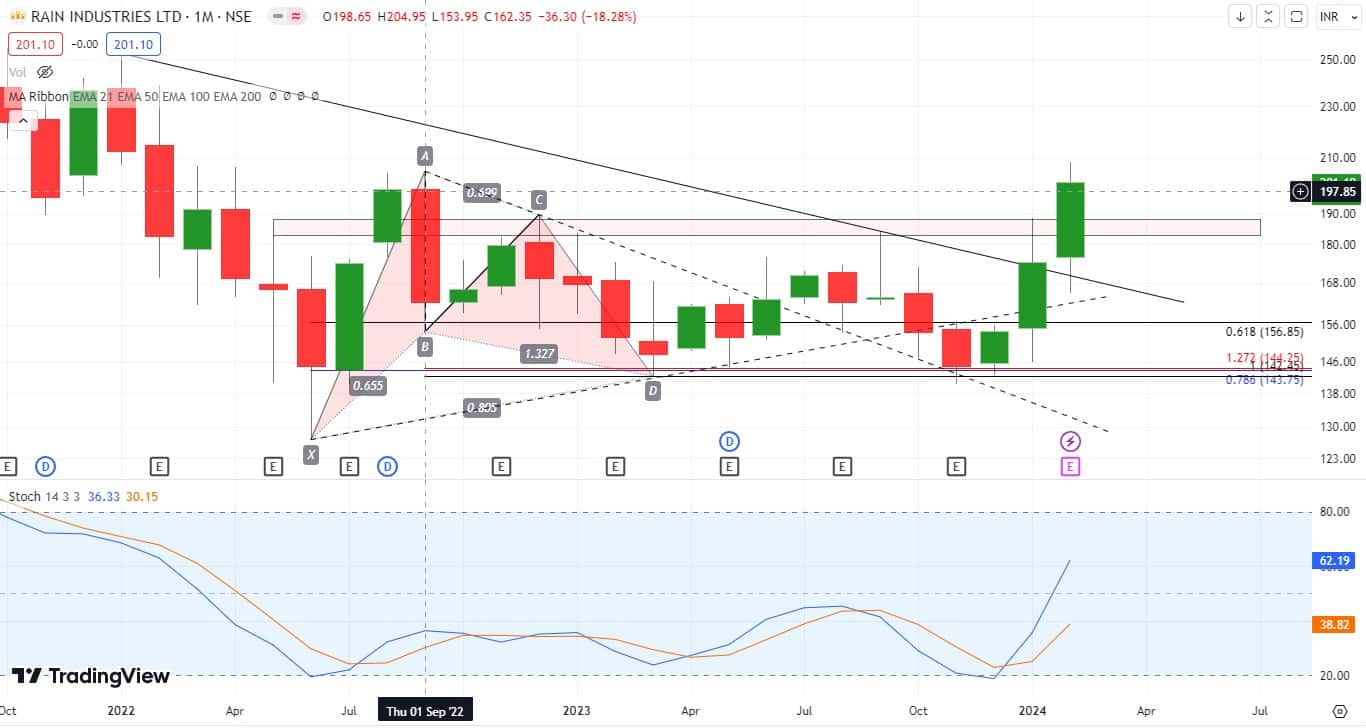
Rain Industries: Buy | LTP: Rs 201 | Stop-Loss: Rs 175 | Target: Rs 240 | Return: 19 percent
From March 2023 till December 2023, the said counter has been consolidating between Rs 145 and Rs 155. Since last 2 months, it has given a breakout from the said range on a weekly closing basis, which is looking lucrative.
Having said that, it has also formed a bullish GARTLEY pattern, which is 1.38 years old, thus making it more reliable. Also, it has violated a couple of trendlines (refer to the chart). The best part about this bullish reversal is that every bottom has bought with huge volume bars (refer to the chart), which indicates bullish bias in the counter.
On the indicator front, the monthly stochastic shying away from being oversold, which further affirms our bullish stance on the counter. Thus, we advised traders and investors to go long in the range of Rs 190-205 with an upside target of Rs 240, and the stop-loss would be placed at Rs 175 on a daily close basis.
Note: The Gartley pattern is a harmonic chart pattern, based on Fibonacci numbers and ratios, that helps traders identify reaction highs and lows.

Discover the latest Business News, Sensex, and Nifty updates. Obtain Personal Finance insights, tax queries, and expert opinions on Moneycontrol or download the Moneycontrol App to stay updated!
Find the best of Al News in one place, specially curated for you every weekend.
Stay on top of the latest tech trends and biggest startup news.


