


The market on April 5 ended the first week of the new fiscal year 2024-25 in the green, marking yet another week of rise, surpassing the previous record high to trade beyond 22,600 during the week.
The benchmark Nifty index managed to settle the last two sessions above 22,500 amid consolidation and saw higher highs, higher lows formation for the second consecutive week, making experts hopeful of further uptrend towards 22,700-22,800 in the coming sessions, with support at 22,300-22,200 levels, and the volatility index diving to November 2023 lows.
The Nifty 50 gained 0.84 percent to settle at a record closing high of 22,513.70 for the week, and formed a small bullish candlestick pattern with long upper and lower shadows, which resemble High Wave kind of candlestick pattern on the daily charts, indicating indecisiveness among bulls and bears about future market trend.
From a technical standpoint, as the Nifty index heads into an uncharted territory, it becomes difficult to surface the intermediate resistance, but looking at the recent developments, another leg of 200-300 point (22,700-22,800) rally could be seen on the cards under favourable scenarios, Osho Krishan, senior analyst for technical and derivative research at Angel One, said.
On the lower end, he feels strong support is expected around 22,350-22,300, which certainly has proved its mettle in the previous week, followed by the sacrosanct support at 22,200.
Jigar S Patel, senior manager of equity research at Anand Rathi, also sees support at similar levels, with hurdle on the higher side at 22,600-22,800.
Osho advised traders to refrain from complacency and maintain a pragmatic approach with a stock-centric view for an outperformance.
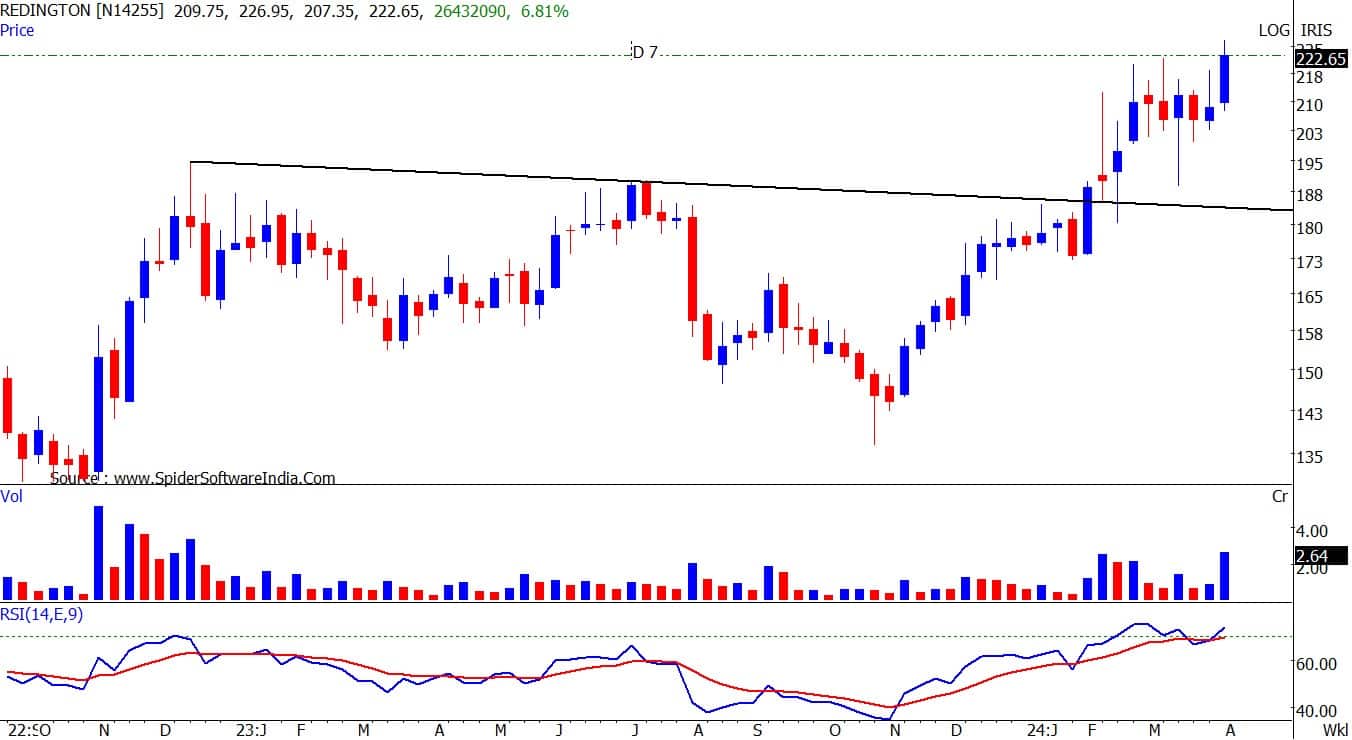
Moneycontrol collated a list of top 10 stock ideas from experts, with 3-4 weeks perspective. The closing price of April 5 is considered for calculation of stock price return:Expert: Vinay Rajani, CMT, senior technical & derivative analyst at HDFC SecuritiesRedington: Buy | LTP: Rs 222.80 | Stop-Loss: Rs 208 | Target: Rs 244 | Return: 9.5 percent
The stock price has broken out from the consolidation, which held for last 6 weeks. Price rise is accompanied by rise in volumes. Primary trend of the stock has been bullish with higher tops and higher bottoms on the weekly chart.
The stock is placed above all important moving averages, indicating bullish trend on all time frames. Indicators and oscillators have been showing strength in the current uptrend.
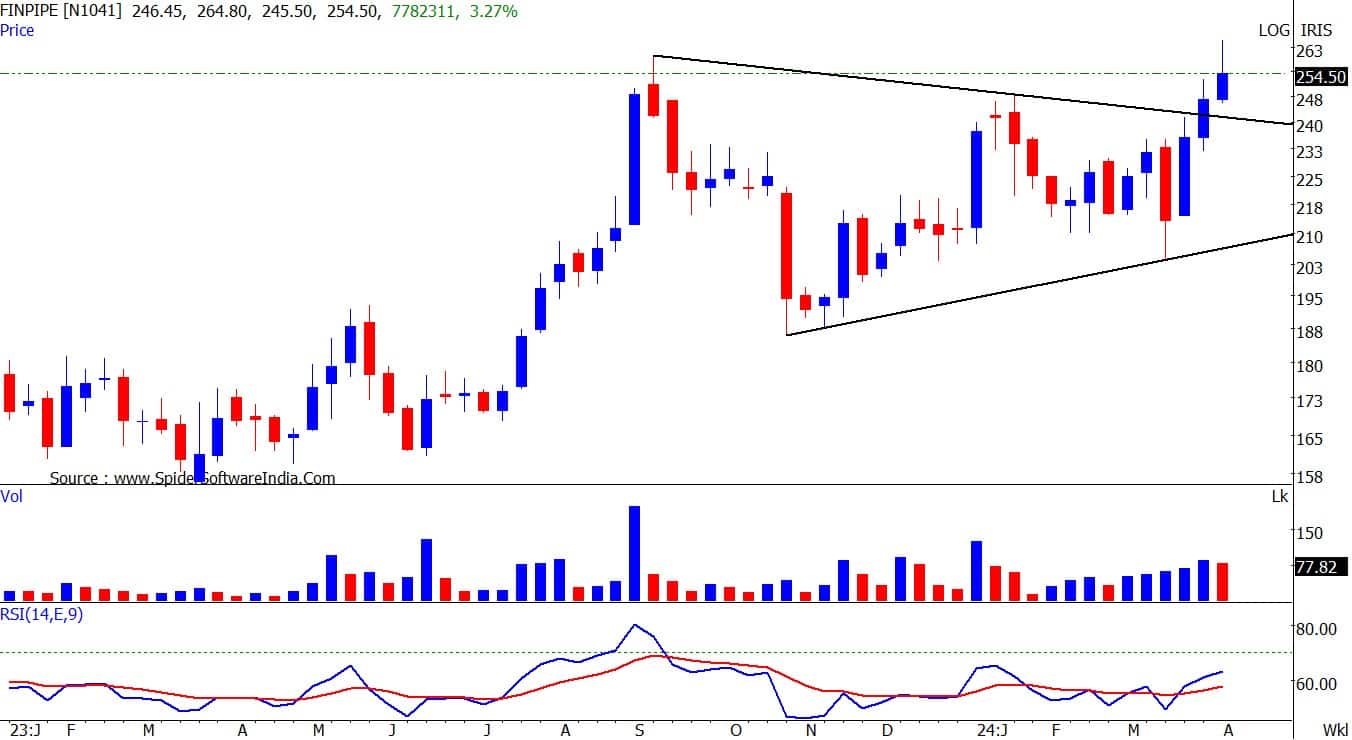
Finolex Industries: Buy | LTP: Rs 255 | Stop-Loss: Rs 240 | Target: Rs 278 | Return: 9 percent
The stock has broken out from the symmetrical triangle on the weekly chart. Price breakout is accompanied by jump in volumes.
Primary trend of the stock has been bullish with higher tops and higher bottoms on the weekly chart. Stock is placed above all important moving averages, indicating bullish trend on all time frames.
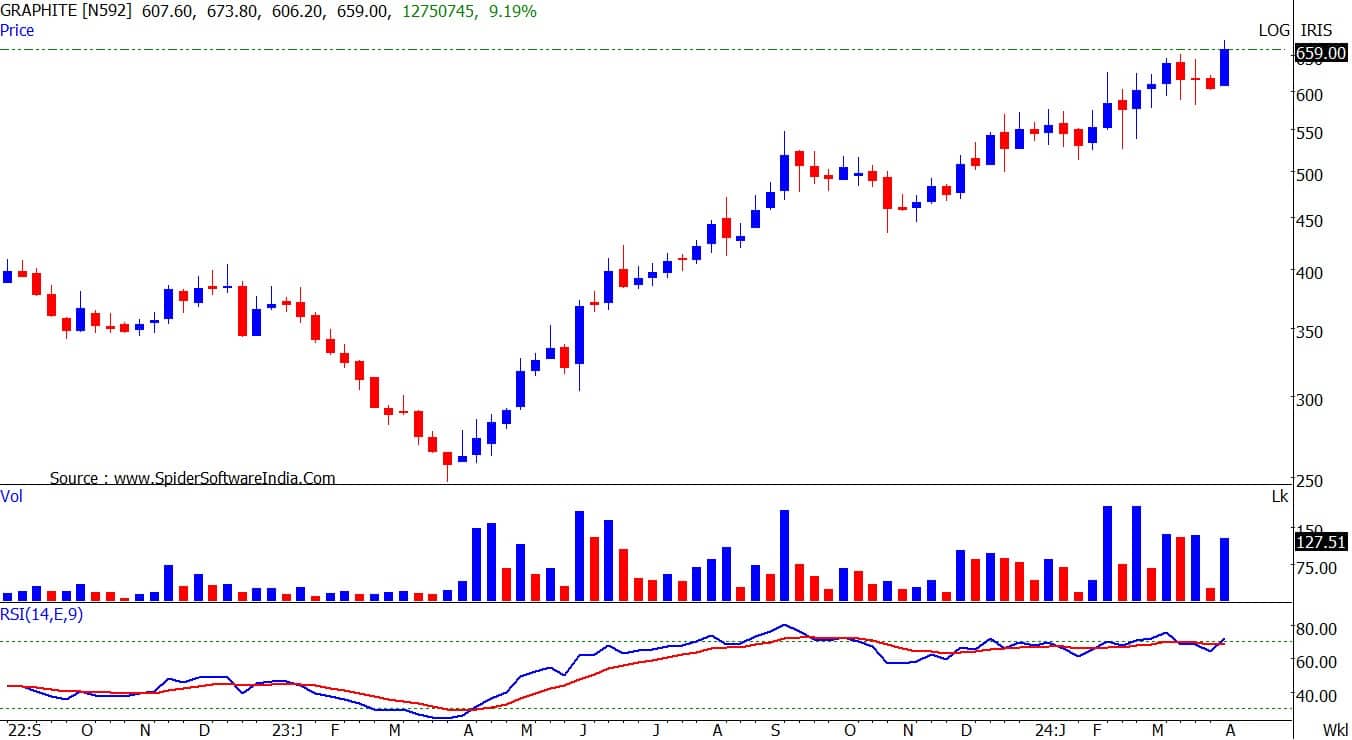
Graphite India: Buy | LTP: Rs 659 | Stop-Loss: Rs 628 | Target: Rs 710 | Return: 8 percent
The stock price has broken out from the narrow consolidation, which held in last 5 weeks. Breakout is accompanied by jump in volumes.
The stock price has also broken out from downward sloping trend line on the monthly chart. Stock is placed above all important moving averages, indicating bullish trend on all time frames.
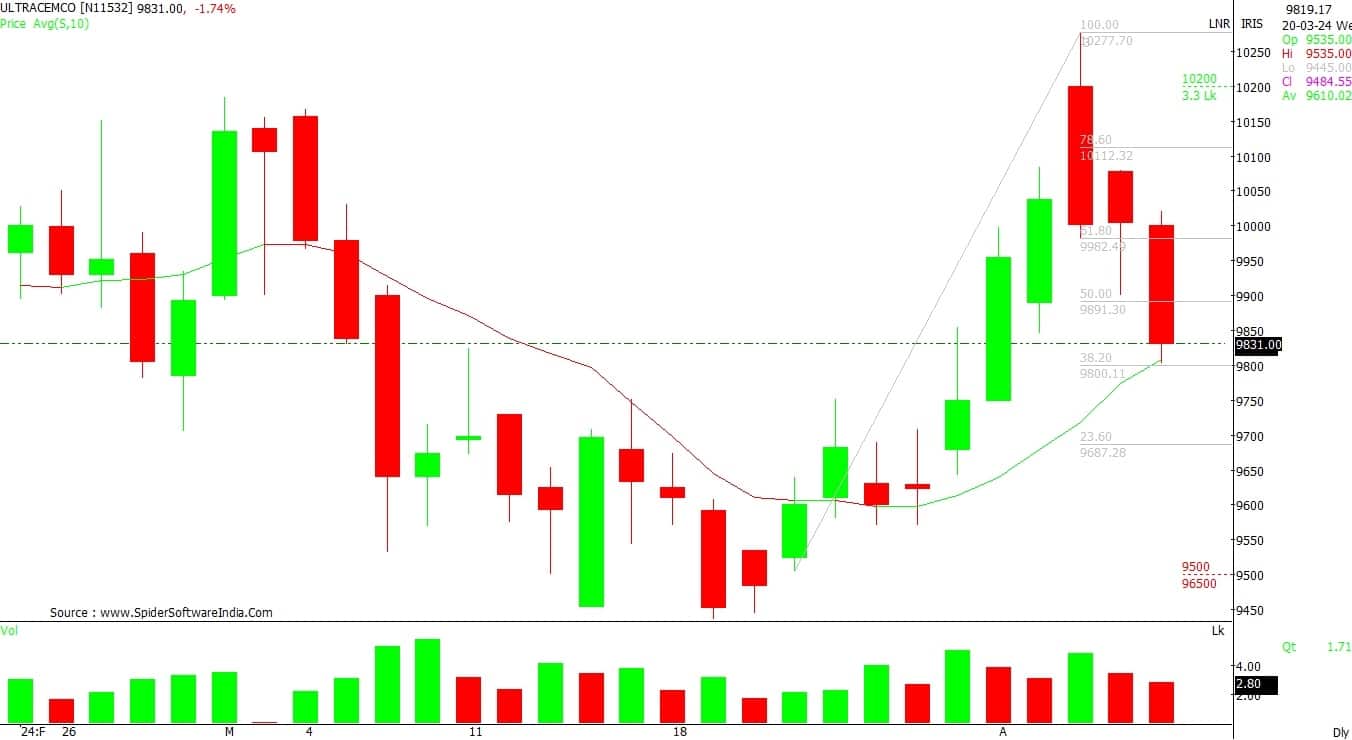
UltraTech Cement: Buy | LTP: Rs 9,824 | Stop-Loss: Rs 9,490 | Target: Rs 10,500 | Return: 7 percent
After the remarkable up move of the last few weeks, the counter witnessed short-term correction from the higher levels. However, closing above the important retracement levels suggest bullish continuation chart formation.
Therefore, the counter is likely to resume its uptrend from the current levels in the near term.
HCL Technologies: Buy | LTP: Rs 1,545 | Stop-Loss: Rs 1,490 | Target: Rs 1,650 | Return: 7 percent
The counter is in the accumulation zone where it is trading in a rangebound mode for the past few sessions. The texture of the chart formation and technical indicator RSI (relative strength index) is indicating that the counter is very likely to breakout from rectangle formation for a new leg of the up move in the coming horizon.

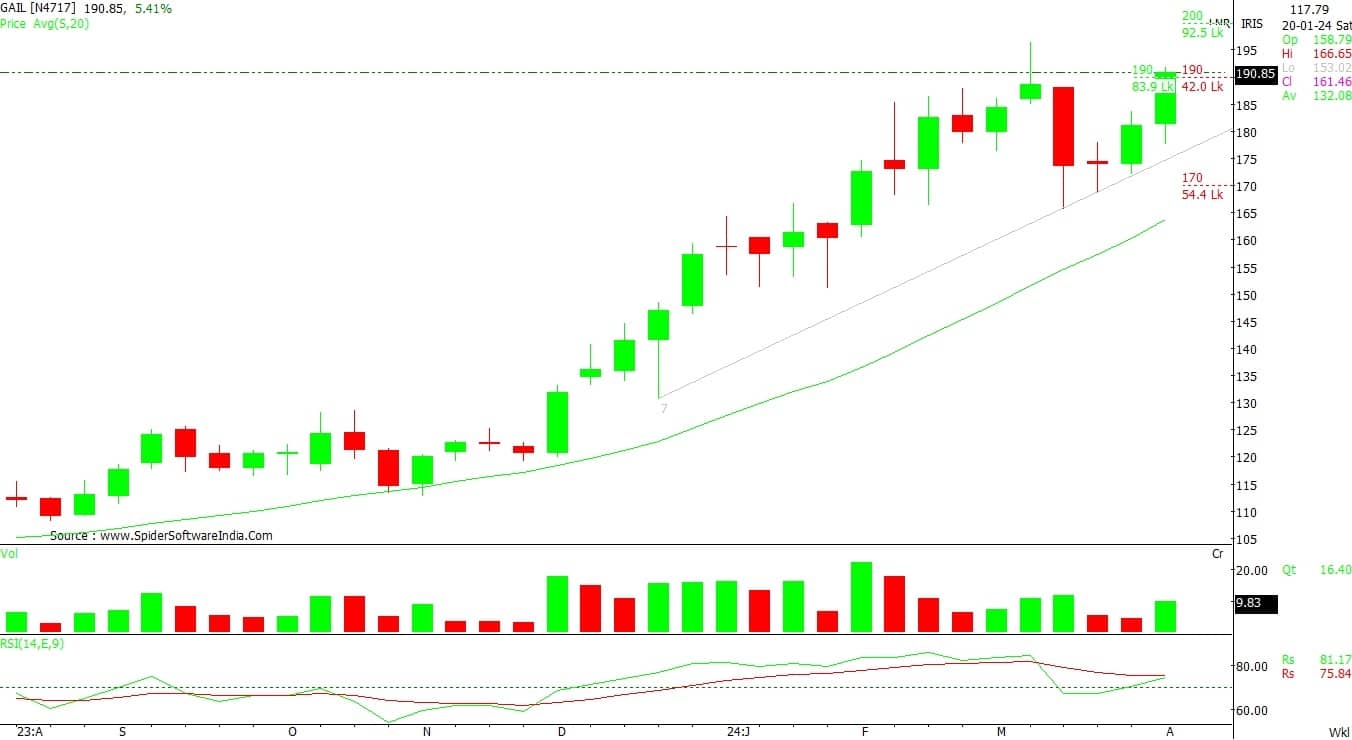
GAIL India: Buy | LTP: Rs 190.75 | Stop-Loss: Rs 183 | Target: Rs 205 | Return: 7.5 percent
On the weekly charts, the counter is into a rising channel chart formation with higher high and higher low series pattern. Additionally, the technical indicators like ADX (average directional index) and RSI are also indicating further up trend from current levels which could boost the bullish momentum in the near future.
Varroc Engineering: Buy | LTP: Rs 537.85 | Stop-Loss: Rs 512 | Target: Rs 610 | Return: 13 percent
The stock has given a good breakout above its anchor VWAP (volume-weighted average price) resistance mark of Rs 530 and managed to close above the same. With the price retesting its support zone and offering a good risk-to-reward opportunity at current levels, along with the RSI on daily charts being around 58, the momentum still appears strong.
The stock seems like a good buy with a strict stop-loss of 512 for potential upside targets of Rs 610 and above.

Bajel Projects: Buy | LTP: Rs 226.50 | Stop-Loss: Rs 209 | Target: Rs 250 | Return: 10 percent
The stock has given a good breakout above its recent 6-day consolidation phase, which formed after the trendline breakout on its daily charts. With the major trend being positive and the anchor VWAP showing good demand in the stock, along with major support at Rs 175 levels, the stock looks like a good buy with a small stop-loss at Rs 209 for potential upside target of Rs 250 and above.
The RSI (14) on daily charts at 62.20 and in a rising trend show strong momentum in the stock.

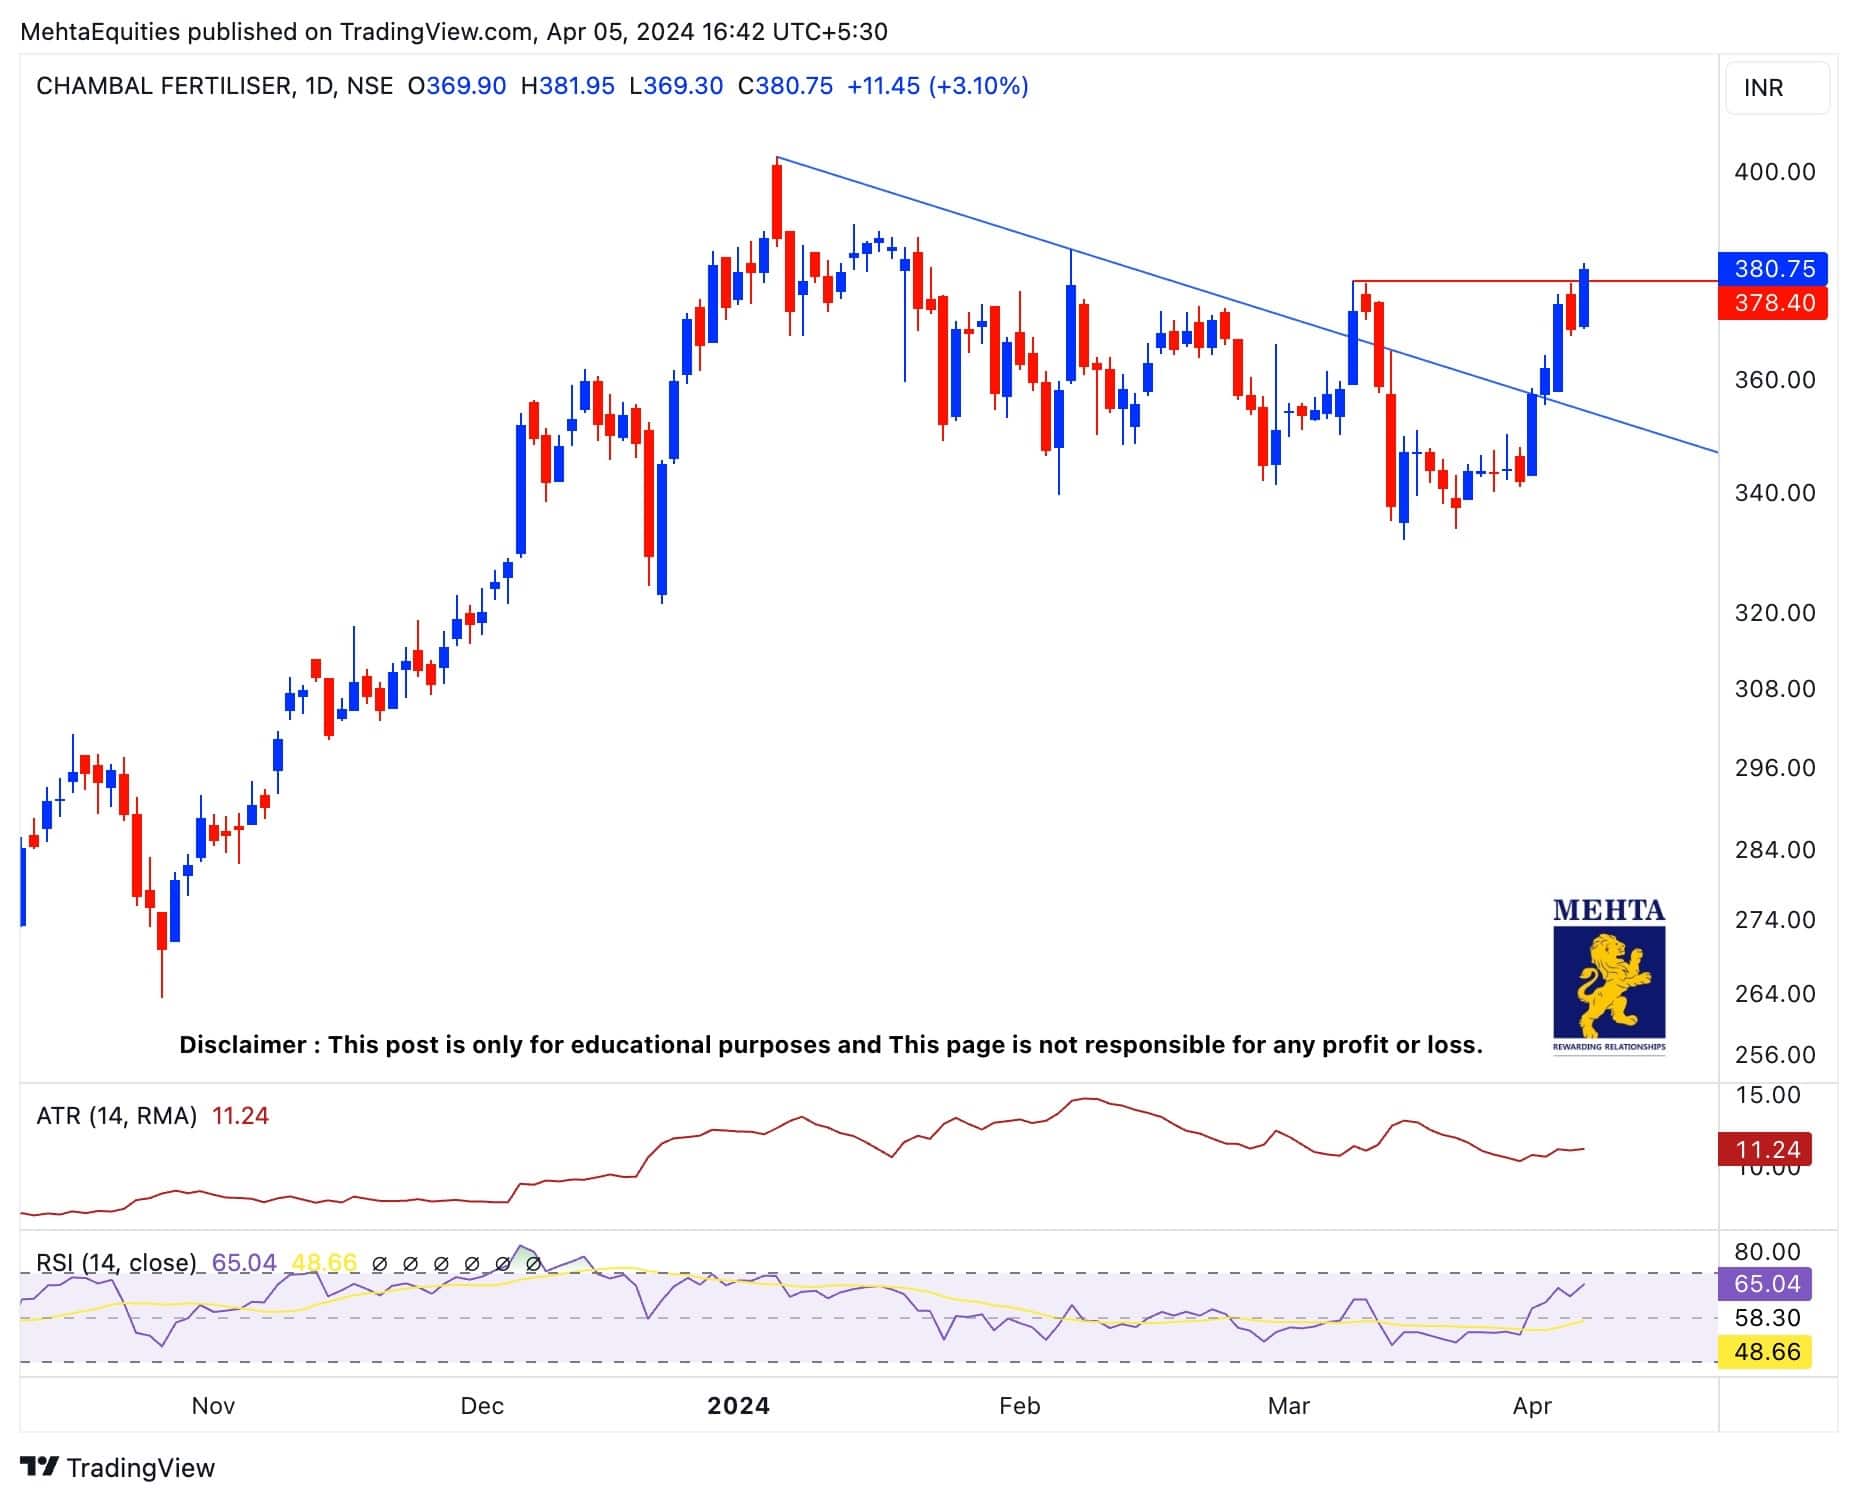
Chambal Fertilisers and Chemicals: Buy | LTP: Rs 380.75 | Stop-Loss: Rs 372 | Target: Rs 402.50 | Return: 6 percent
The stock has given a good breakout above its recent swing high mark of rs 378.40 and successfully managed to close above the same. With the RSI (14) on daily charts near 65.04, the momentum looks strong for potential upside target of Rs 402.50 and above, with a strict stop-loss at Rs 372 mark.
Overall, a strong technical structure for most of the fertilizer stocks and an interesting risk-reward ratio on Chambal makes the stock an intriguing candidate.
Syngene International: Buy | LTP: Rs 729.5 | Stop-Loss: Rs 708 | Target: Rs 775 | Return: 6 percent
The stock has bounced back after forming a double bottom pattern in a daily time frame with significant volumes. The stock appears to be strongly placed above the middle Bollinger band and RSI holds above 60 levels.
If the stock manages to close above Rs 736 level, it could move higher further. Hence, based on the above technical structure, one can initiate a long position at CMP Rs 729.5 for a target price of Rs 775. The stop-loss can be kept at Rs 708.

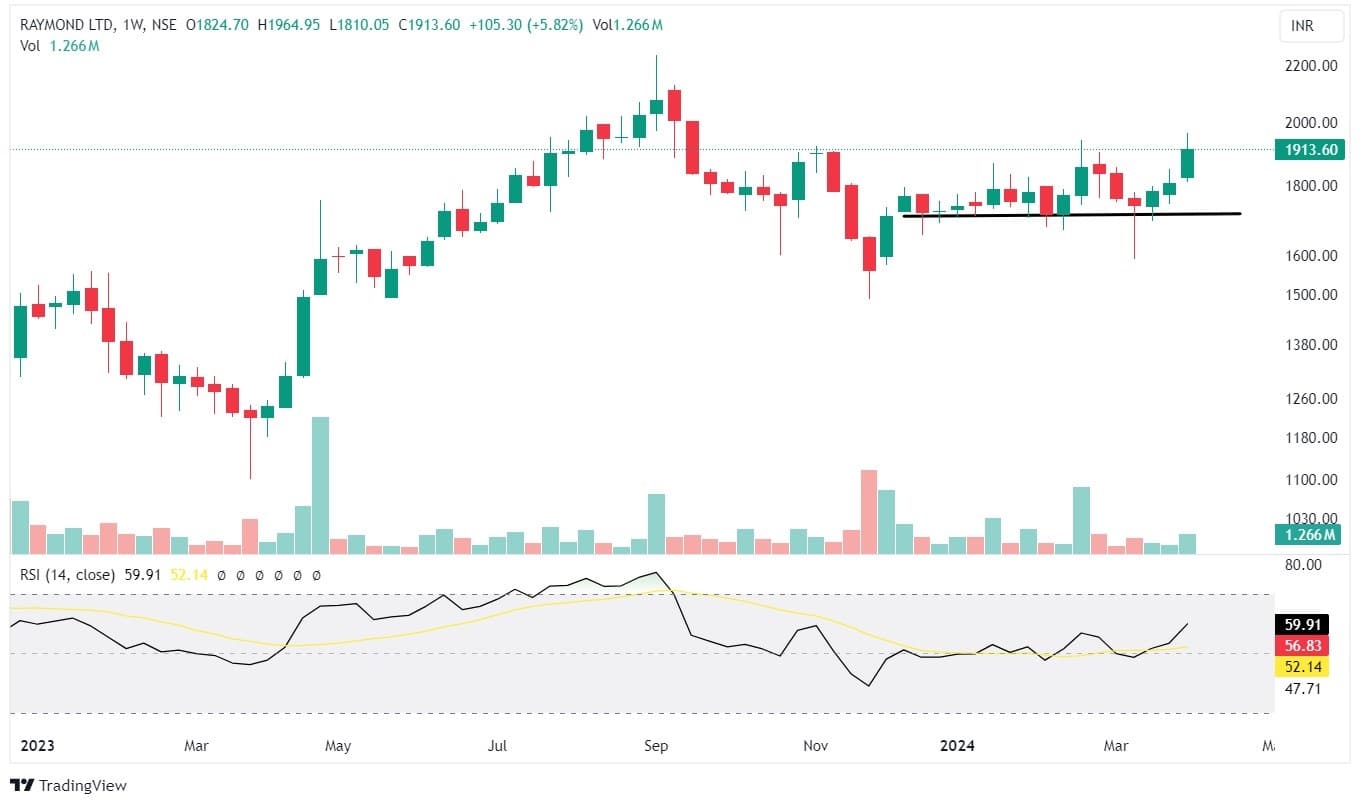
Raymond: Buy | LTP: Rs 1,913.6 | Stop-Loss: Rs 1,850 | Target: Rs 2,090 | Return: 9 percent
The stock is forming higher highs and higher lows indicating a sustained uptrend. A Bullish momentum is evident as the 9-day simple moving average (SMA) has crossed above the 20 SMA, signifying a strengthening trend. The stock is on the verge of a potential breakout.
Hence, based on the above technical structure, one can initiate a long position at CMP Rs 1,913.6 for a target price of Rs 2,090. The stop-loss can be kept at Rs 1,850.
Discover the latest Business News, Sensex, and Nifty updates. Obtain Personal Finance insights, tax queries, and expert opinions on Moneycontrol or download the Moneycontrol App to stay updated!
Find the best of Al News in one place, specially curated for you every weekend.
Stay on top of the latest tech trends and biggest startup news.


