


Gold prices climbed Rs 179 to Rs 51,106 per 10 gram in the Mumbai market on positive global cues, disappointing economic data and sell-off in equity markets, but the gains were capped by an appreciating rupee versus the dollar.
The yellow metal ended the week marginally down Rs 71, or 0.14 percent, for the week.
The fall in weekly jobless claims in the US and positive manufacturing data released early this week is taking some shine off the yellow metal.
The rate of 10 gram 18, 22 and 24-carat gold in Mumbai was Rs 38,330, Rs 46,813 and Rs 51,106, respectively, plus 3 percent GST.
MCX iCOMDEX Bullion Index was up 73.55 points, or 0.46 percent, at 15,932.03 at 17:30 pm. The index tracks real-time performance of MCX gold and silver futures.
“Gold may remain choppy as US equity markets are showing some vulnerability to correction while the US Dollar Index is attempting some recovery. We expect buying interest to emerge at a lower level as Fed’s dovish stance and mixed US economic data may limit the upside in the dollar,” Ravindra Rao, VP-Head Commodity Research at Kotak Securities, said.
The gold-to-silver ratio currently stands at 79.31 to 1, which means the amount of silver required to buy one ounce of gold.
Silver prices were up marginally Rs 44 to Rs 64,437 per kg from its closing on September 3.
In the futures market, gold rate touched an intraday high of Rs 50,997 and a low of Rs 50,707 on the Multi-Commodity Exchange (MCX). For the October series, the yellow metal touched a low of Rs 45,596 and a high of Rs 56,191.
Gold futures for October delivery gained Rs 207, or 0.41 percent, at Rs 50,949 per 10 gram in evening trade on a business turnover of 13,950 lots. The same for December delivery edged higher Rs 187, or 0.37 percent, at Rs 51,180 on a business turnover of 5,037 lots.
The value of the October and December contracts traded so far is Rs 2,409.07 crore and Rs 89.89 crore, respectively.
Similarly, Gold Mini contract for October jumped Rs 154, or 0.3 percent, at Rs 50,977 on a business turnover of 17,066 lots.
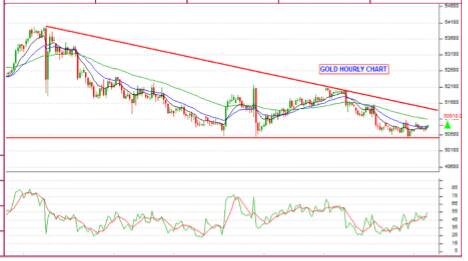
On the technical charts, gold is trading in a descending triangle pattern. It has broken below its ‘rising trend line’ on the daily chart and has sustained below its 50-day simple moving average (SMA), which suggest more downside in the counter in the near term.
"Any breakdown below Rs 50,500 would push price lower towards Rs 50,100-50,000 levels," Axis Securities said in a recent note.
Sachin Gupta, Senior Research Associate, Choice Broking, too expects prices to correct slightly further towards its immediate support around Rs 50,500-50,300 levels.
At 12:10 (GMT), spot gold was up $6.23 at $1,937.14 an ounce in London trading.
For all commodities related news, click here
Discover the latest Business News, Sensex, and Nifty updates. Obtain Personal Finance insights, tax queries, and expert opinions on Moneycontrol or download the Moneycontrol App to stay updated!
Find the best of Al News in one place, specially curated for you every weekend.
Stay on top of the latest tech trends and biggest startup news.


