


The market achieved a fresh milestone on December 1, the first day of the last monthly series of the current calendar year, with the Nifty50 exceeding its previous record high after two-and-a-half months to hit 20,285 points.
Renewed buying by foreign institutional investors (FIIs), raging hopes that the US Federal Reserve has stopped raising the rates and a reversal is on the cards backed by strong fundamentals, and robust economic growth back home in India have been the main growth drivers for the record rally in the equity market.
Technically, the Nifty50 looks on course to reach another milestone of 20,500 points soon, considering the healthy bullish candlestick pattern on the daily charts with continuation of higher-highs-higher-lows for four days in a row and staying above all key moving averages, while 20,000 is expected to be a crucial support from here on, experts said.
Historically, December has been the best month for the Nifty50 with more than 3 percent average return, if we were to consider the monthly performance data for the last 29 years. So, the probability of the Indian markets continuing its upward journey this month looks high, said Vinay Rajani, CMT, senior technical and derivative analyst at HDFC Securities.
The Nifty50 jumped 136 points or 0.7 percent to 20,269 at 1:22pm after the end of uncertainty related to exit poll in five state elections, taking the total gains to 7.7 percent from the October low of 18,837.85. All the sectors supported the market, barring IT.
Also read: Why Sensex lags behind Nifty in race to new highs? Blame it on these top gainers BSE index lacks
"The sentiment remains strong as long as it stays above the 20,000 mark and also continued buy-on-dips strategy. On the higher side, the index could potentially move towards 20,450-20,500," Rupak De, senior technical analyst at LKP Securities, said.
The broader markets also maintained the upward move, with the Nifty Midcap 100 index gaining 1.15 percent and Nifty Smallcap 100 index rising 0.7 percent, while India VIX stayed below 13.
The BSE Sensex, which traded 494 points higher at 67,482, is yet to surpass its previous record high of 67,927.23 reached on September 15.
Let's take a look at the top 10 trading ideas from experts for the next three-four weeks. Returns are based on the November 30 closing prices.
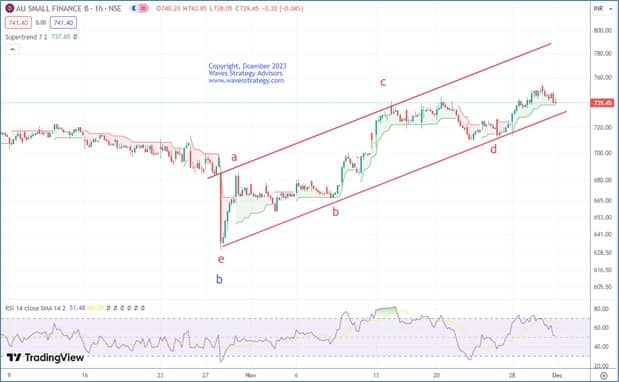
Expert: Ashish Kyal, CMT, Founder and CEO of Waves Strategy AdvisorsAU Small Finance Bank: Buy | LTP: Rs 741.4 | Stop-Loss: Rs 720 | Target: Rs 780 | Return: 5 percent
Despite the index rallying, AU Small Finance Bank saw some profit-booking in the previous session. The chart shows that prices have just closed above the cloud, keeping the overall tone positive. Wave b appears to be completed on the downside, as prices have retraced nearly 78.6 percent of the previous leg.
We used Supertrend on the hourly chart. It has served as a strong support and resistance, and prices are taking support at the moment. We can now expect an upward bounce. Furthermore, the entire sector is up, so the overall outlook remains positive.
Overall, the trend for AU Small Finance Bank looks positive. Any break above Rs 755 will take the stock towards Rs 780 levels, whereas on the downside Rs 720 can act as a nearest support.
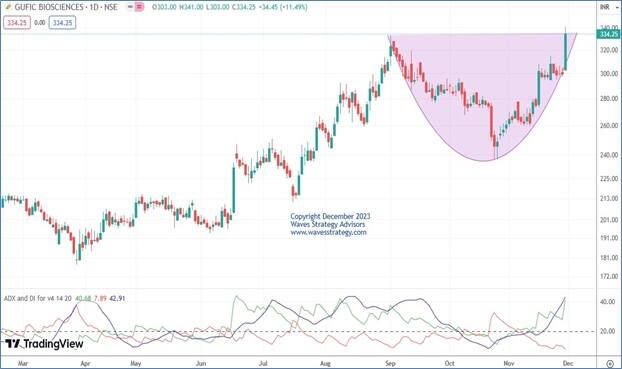
Gufic Biosciences: Buy | LTP: Rs 334.25 | Stop-Loss: Rs 315 | Target: Rs 350 | Return: 5 percent
Gufic Biosciences has been moving higher recently and intact in strong uptrend. On the daily chart, in the previous session prices formed a bullish candle. Price has closed above Rs 333 which confirm breakout of the rounding bottom pattern.
We have shown ADX (average directional index) indicator which gives an indication if the stock is trending or in a trading range. The low readings of ADX indicates that the stock is in a range. The ADX of this stock is 42.91 giving an indication of a trending market. The reading above 25 means strong directional strength.
As shown on the hourly chart, price has recently bounced from the Ichimoku cloud which can act as near-term support zone. Closest support is placed at Rs 315.
In short, trend for this stock is positive. Use dips towards Rs 325 as a buying opportunity for a move towards Rs 350 levels as long as Rs 315 holds on the downside.
Hindustan Unilever: Buy | LTP: Rs 2,545.55 | Stop-Loss: Rs 2,490 | Target: Rs 2,700 | Return: 6 percent
After consolidating for 8–10 weeks, HUL gave a breakout from its previous trading range along with a bear trendline violation, which is looking lucrative at current levels.
On the indicator front, weekly RSI (relative strength index) is consistently above 50 levels, along with weekly DMI's (directional movement index) that are positive, thus adding further confirmation of bullish bias.
One can buy in the zone of Rs 2,550–2,570, and the target would be Rs 2,700, and the stop-loss would be Rs 2,490 on a daily close basis.

Jubilant Foodworks: Buy | LTP: Rs 560.85 | Stop-Loss: Rs 520 | Target: Rs 655 | Return: 17 percent
On a daily scale, the said counter has taken out the previous swing high of Rs 556. On a weekly scale, price action is sustaining above all major exponential averages, which is a sign of bullishness.
On the indicator front, the daily RSI has taken out its previous swing high, along with the daily DMI’s bullish cross, which further confirms our bullish stance in the counter.
On a daily close basis, one can buy in the zone of Rs 560–570 with an upside target of Rs 655 and a stop-loss of around Rs 520 on a daily close basis.

Chambal Fertilisers and Chemicals: Buy | LTP: Rs 318.25 | Stop-Loss: Rs 285 | Target: Rs 365 | Return: 15 percent
Chambal Fertilisers has been consolidating for some time on the weekly chart. Recently, it had a breakout with huge volume. On the indicator front, weekly RSI is about to enter the 70 zone, along with weekly DMI, which has turned positive, thus looking lucrative.
Thus, we advise traders to go long in the stock in the range of Rs 315-320 with a stop-loss of Rs 285 and target of Rs 365

SAIL: Buy | LTP: Rs 92.30 | Stop-Loss: Rs 87 | Target: Rs 102 | Return: 10.5 percent
Steel Authority of India stock is trading above 20 and 50 simple moving averages (SMA), ratifying the support in price action. Also, Inverse Head and Shoulder formation is indicated in the daily chart. The price has been trading above Ichimoku Cloud & positive crossover is indicated in MACD (moving average convergence divergence) indicator indicating the continuity of the ongoing trend.
There is minor resistance around Rs 94 levels once it sustains above these levels strong traction is expected.
Hence, based on the above technical structure one can initiate a long position at Rs 92.7. However, on the safer side nearby Rs 91-92 levels would be a better range to enter. Closing and sustaining above Rs 94 would lead toward Rs 102 levels in the coming days. Stop-loss can be kept as Rs 87.

Britannia Industries: Buy | LTP: Rs 4,852.65 | Stop-Loss: Rs 4,748 | Target: Rs 5,200 | Return: 7 percent
On a weekly chart, the stock has been trading with the support of a middle Bollinger band which suggests a positive bias. Additionally, the stock has formed a strong base around Rs 4,700 levels and is sustaining above these levels.
Stochastic, a daily momentum indicator shows a positive crossover which adds more bullishness to the price.
Hence, based on the above technical structure one can initiate a long position at current market price. Closing and sustaining above Rs 4,920 will lead towards Rs 5,150-5,200 levels in the coming days. Stop-loss can be kept as Rs 4,748.

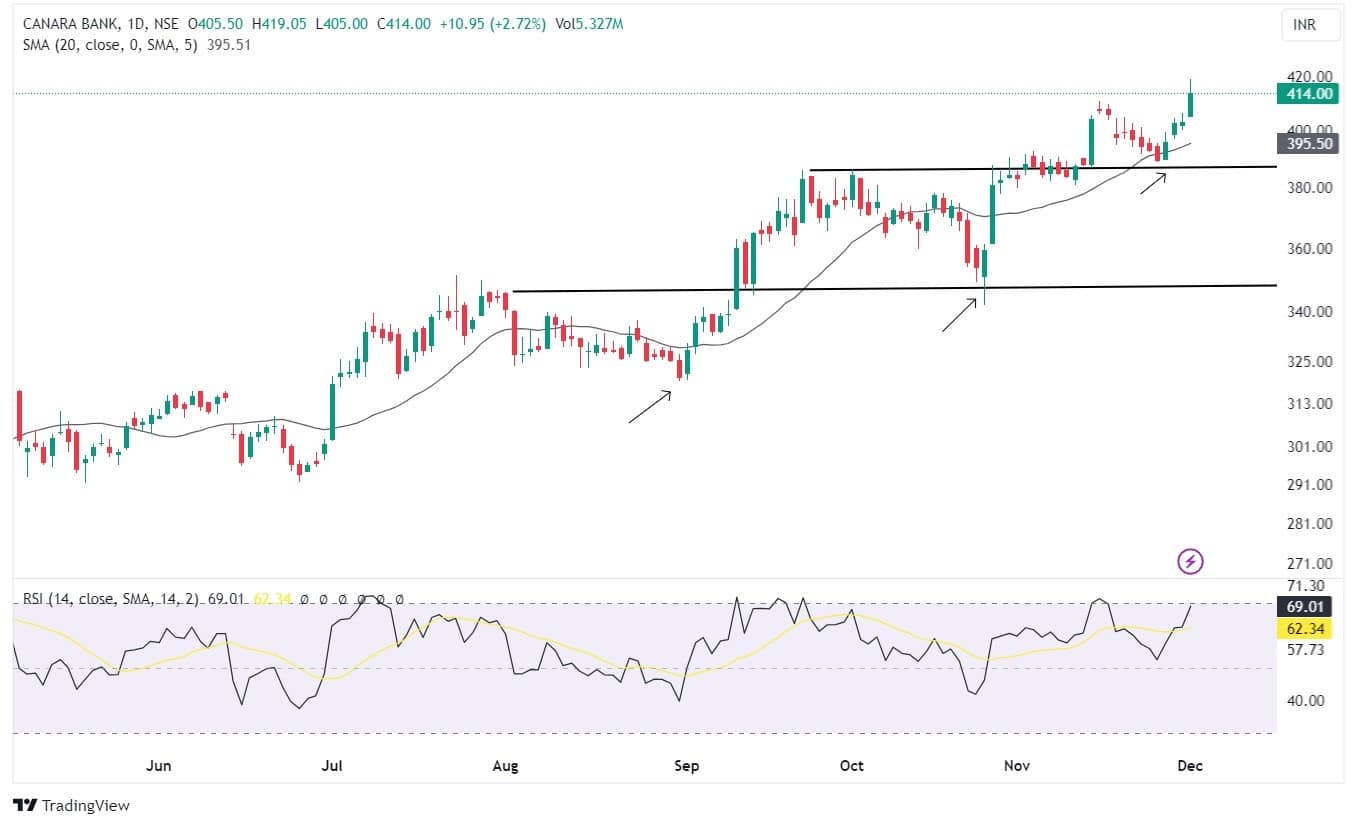
Canara Bank: Buy | LTP: Rs 403 | Stop-Loss: Rs 397 | Target: Rs 440 | Return: 9 percent
The stock is forming higher high and higher low formation in the daily chart. Stock is trading above 20 and 50 DMA, indicating strength in price action. Also positive crossover is indicated in MACD while RSI stands at 70 levels.
Price is sustaining above Rs 405 levels with decent volumes, pointing out buying interest among the short-term traders.
Hence, based on the above technical structure one can initiate a long position at current market price. However, on the safer side nearby Rs 410 levels would be a better range to enter for the target price of Rs 440. The stop-loss can be kept as Rs 397.
Sun Pharmaceutical Industries: Buy | LTP: Rs 1,226 | Stop-Loss: Rs 1,170 | Target: Rs 1,350 | Return: 10 percent
Sun Pharma's stock has recently surged to its all-time high, surpassing the previous peak of Rs 1,200 in April 2015.
Following a 15-week consolidation period from July to November 2023, marked by a rectangle pattern, the stock has broken out of this range, signaling the end of the consolidation phase and indicating a continuation of the prior uptrend.
During the consolidation, the stock found consistent support around the 12-week exponential moving average (EMA), which played a crucial role as a dynamic support level for the prices.
Additionally, the relative strength index (RSI) is noteworthy, quoting above the 60 mark on higher time frames. This reflects the presence of positive momentum in the stock.
Moving forward, we expect the prices to ascend further towards Rs 1,350 mark. It is advised to place the stop-loss at Rs 1,170, strictly based on the closing basis.

HCL Technologies: Buy | LTP: Rs 1,340.90 | Stop-Loss: Rs 1,290 | Target: Rs 1,475 | Return: 10 percent
The stock is currently experiencing a robust uptrend, reaching an all-time high. The absence of lower lows and lower highs underscores the stock's healthy trend.
After a breakout, the stock retested the neckline of a rounding pattern, signifying a continuation of the upward trajectory and the initiation of an upward trend.
On the weekly charts, prices have consistently adhered to short-term averages, affirming the prevailing uptrend. Additionally, the RSI on both weekly and daily charts is above the 60 mark, indicating the presence of positive momentum in the stock.
Looking ahead, we anticipate further upward movement in prices, targeting Rs 1,475 levels. It is recommended to set a stop-loss at Rs 1,290 based on closing values.

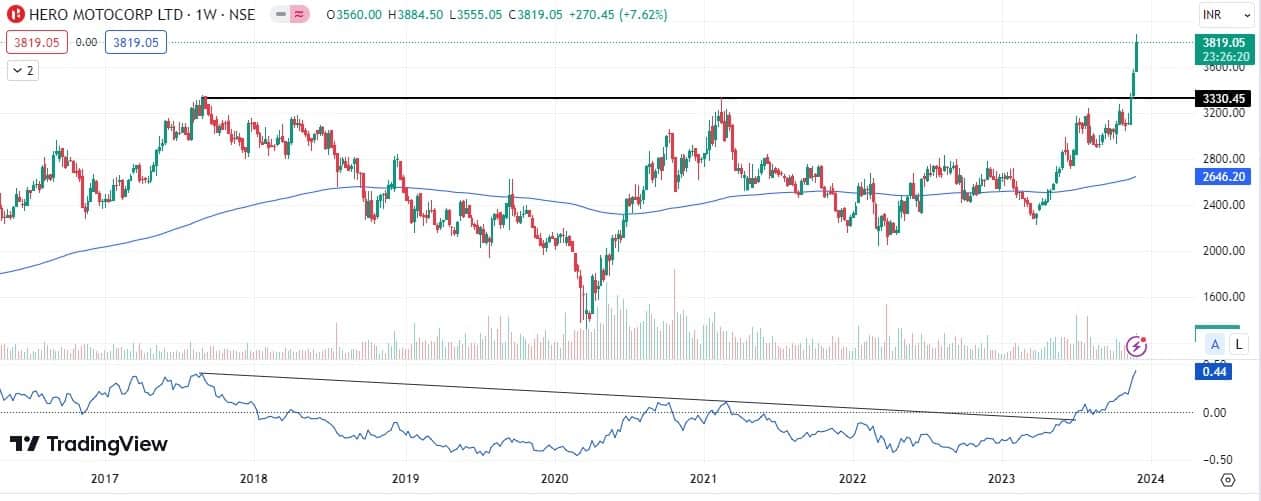
Hero MotoCorp: Buy | LTP: Rs 3,819 | Stop-Loss: Rs 3,630 | Target: Rs 4,284 | Return: 12 percent
The stock under consideration is currently demonstrating a robust upward trend characterized by a pattern of higher highs and higher lows. Notably, the stock is trading at its all-time highs, indicating a strong buying interest and an optimistic market sentiment.
Furthermore, key breakout points in August 2017 and February 2021 are significant milestones in the stock's trajectory. The fact that the current week's trading surpasses the high of the breakout candle provides confirmation of the continued upward momentum.
The stock is trading above its 200-week exponential moving average (EMA), a long-term trend indicator. This, coupled with supportive trading volumes, reinforces the positive trend.
In addition to the stock's individual performance, its relative strength against the Nifty, as depicted in the ratio chart, is noteworthy. The breakout from a downward-sloping trend line since August 2017 indicates that the stock is not only performing well in absolute terms but is also outpacing the broader market.
Looking ahead, we anticipate further upward movement in prices, targeting Rs 4,284 levels. It is recommended to set a stop-loss at Rs 3,630 based on closing values.
Discover the latest Business News, Sensex, and Nifty updates. Obtain Personal Finance insights, tax queries, and expert opinions on Moneycontrol or download the Moneycontrol App to stay updated!
Find the best of Al News in one place, specially curated for you every weekend.
Stay on top of the latest tech trends and biggest startup news.


