


Throughout the week ended February 23, the Nifty index experienced significant fluctuations, driving traders on a roller coaster ride. The index managed to close near the 22,200 mark, reflecting a gain of 0.78 percent. Notably, bulls succeeded in reaching a new all-time high during the week in a display of resilience.
In the preceding weekly analysis, attention was drawn to the India VIX showing a triple-top pattern and, as anticipated, it plummeted by approximately 1.5 points, closing with a negative trend of -1.64 percent. Looking ahead, there's a possibility of market stabilisation as the volatility index goes into a cooling-off period.n
In the upcoming sessions, the psychological level of 22,000 is expected to serve as a significant support zone, with any breach below potentially triggering further panic selling. Conversely, a daily close above 22,300 could propel the Nifty towards the 22,500 mark.
In the context of the Nifty Bank index, despite a notable recovery from the 200-day exponential moving average (DEMA), the index concluded the last week with a 0.92 percent gain, signifying a degree of buying interest from lower levels. However, attention is drawn to the daily stochastic, which has displayed a bearish cross above the overbought zone, hinting at the likelihood of sideways movement in the Bank Nifty in the forthcoming weeks. It becomes crucial for the Bank Nifty to maintain support at the 46,500 level this week.
Sustaining above this level could pave the way for testing the 47,500 mark, indicative of further bullish momentum. Conversely, a failure to hold support at 46,500 may invite additional selling pressure, potentially driving the Bank Nifty towards the subsequent support level at 46,000.
Here are three buy calls for 2-3 weeks:
Piramal Enterprises: Buy | LTP: Rs 933.55 | Stop-Loss: Rs 860 | Target: 1,055 | Return: 13 percent
In September 2023, PEL reached its zenith, soaring to nearly Rs 1,140. However, it subsequently endured a substantial downturn, plummeting by almost 300 rupees, constituting a significant 26 percent decline. Presently, the stock seems to have discovered a level of support within the bracket of Rs 840-900, suggesting a potential stabilization in its price movement.
Notably, recent market observations have unveiled the formation of a double bottom pattern on the daily chart, accompanied by bullish divergence—a promising indication for traders. This confluence of technical signals presents an enticing opportunity for market participants.
In light of these developments, traders are advised to contemplate initiating long positions within the range of Rs 915-935. The anticipated target for this bullish trade is positioned at Rs 1,055, representing a potential upside opportunity. To manage risks effectively, it is recommended to set a stop-loss level at Rs 860, to be evaluated based on daily closing prices.

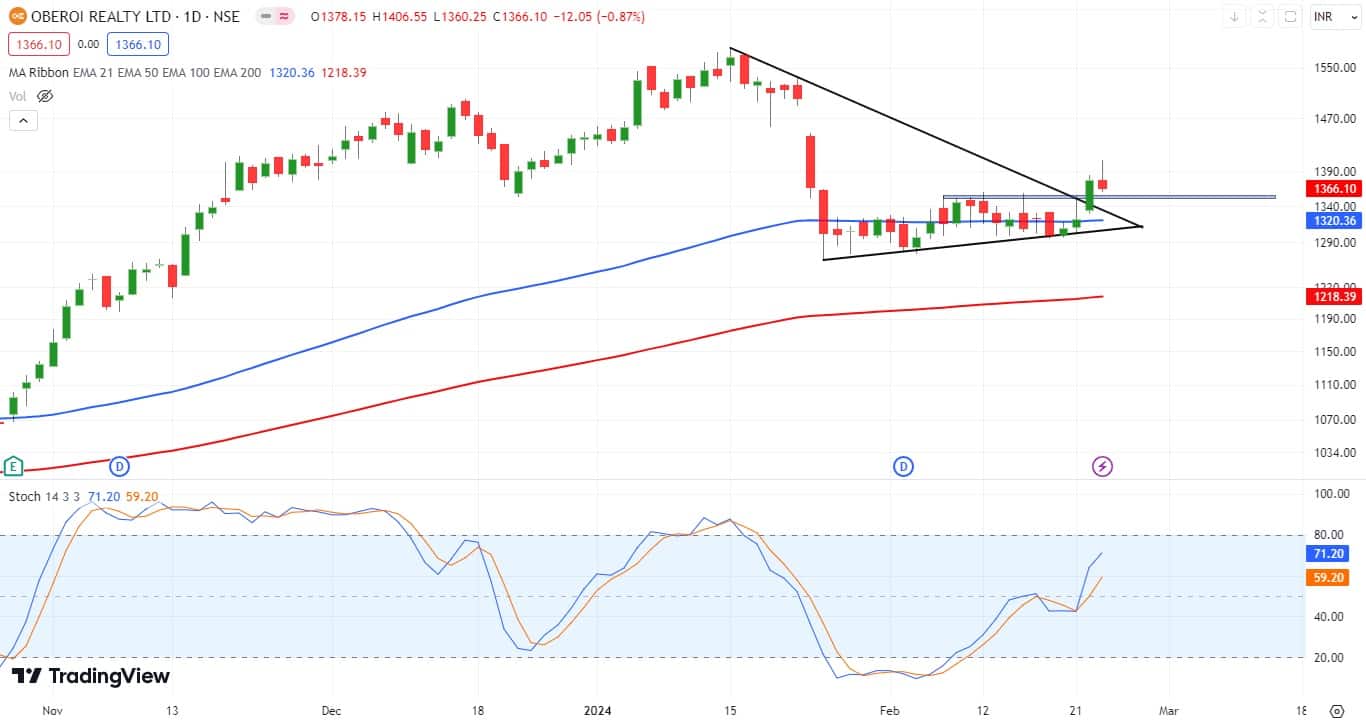
Oberoi Realty: Buy | LTP: Rs 1,366 | Stop-Loss: Rs 1,299 | Target: Rs 1,475 | Return: 8 percent
In the past month, Oberoi Realty has demonstrated a commendable consolidation phase within the range of approximately Rs 1,280 to Rs 1,345, coinciding remarkably with its 100-day exponential moving average (DEMA). However, recent developments have marked a significant shift in market dynamics. The stock has decisively broken out of this consolidation range, marking a notable departure from the previous trading pattern.
It has breached the bearish trendline that has persisted over the last two months, as indicated by the accompanying chart. Moreover, technical indicators are aligning favourably with this bullish sentiment. The daily stochastic oscillator has undergone a bullish crossover and has rebounded from the 40 level, suggesting a reversal of momentum to the upside. This confluence of factors indicates a potential for sustained bullish momentum in the forthcoming week.
In light of these developments, traders are recommended to initiate long positions within the range of Rs 1,345 to Rs 1,370. The upside target for this trade is set at Rs 1,475, reflecting the anticipated continuation of the bullish trend. It is prudent to set a stop-loss at Rs 1,299 on a daily closing basis to mitigate potential downside risks.
Delta Corp: Buy | LTP: Rs 146.7 | Stop-Loss: Rs 127 | Target: Rs 180 | Return: 23 percent
During the most recent trading session, the specified stock exhibited a robust recovery, rebounding sharply subsequent to honoring an eight-month-old bearish trendline. Additionally, noteworthy market activity was observed on February 7, 2024, characterized by a substantial surge in buying volume, accompanied by a large green candlestick formation. However, it is notable that despite the bullish momentum, the lower limit of the aforementioned green candle remains unbreached.
On the technical front, the Stochastic oscillator has signaled a reversal from oversold territory following a notable impulsive rebound, providing further validation for bullish sentiment. Given these developments, investors are encouraged to consider establishing long positions within the range of Rs 140–150.
The anticipated target for this bullish trade is set at Rs 180, reflecting the potential for significant upside movement. To manage potential risks effectively, a stop-loss order is advised to be placed in proximity to Rs 127, to be evaluated based on daily closing prices.


Discover the latest Business News, Sensex, and Nifty updates. Obtain Personal Finance insights, tax queries, and expert opinions on Moneycontrol or download the Moneycontrol App to stay updated!
Find the best of Al News in one place, specially curated for you every weekend.
Stay on top of the latest tech trends and biggest startup news.


