


Grasim Industries broke out of a seven-day consolidation pattern on the daily scale on November 29.
"Along with this breakout, the stock is witnessing above 50-days average volume, indicating accumulation by smart investors," Sudeep Shah, head of technical and derivative research at SBI Securities.
As of 10:41am on November 30, Grasim Industries is trading at Rs 2,011.05, up by 8.50 points or 0.42 percent.
Momentum Indicators
The technical chart of Grasim Industries illustrates a consolidation breakout. The stock is trading above its short and long-term moving averages. "These averages are in a rising trajectory, which is a bullish sign. The momentum indicators and oscillators also suggest bullish momentum. The daily Relative Strength Index (RSI) is in a super bullish zone, as per RSI range shift rules. The daily Moving Average Convergence Divergence (MACD) stays bullish as it is quoting above its zero line and signal line. On the daily timeframe, Average Directional Index (ADX) is quoting below 10, suggesting that the trend is yet to be fully developed. Directional indicators continue in the ‘buy’ mode as positive Directional Indicator (+DI) remains above negative Directional Indicator (-DI)," added Shah.
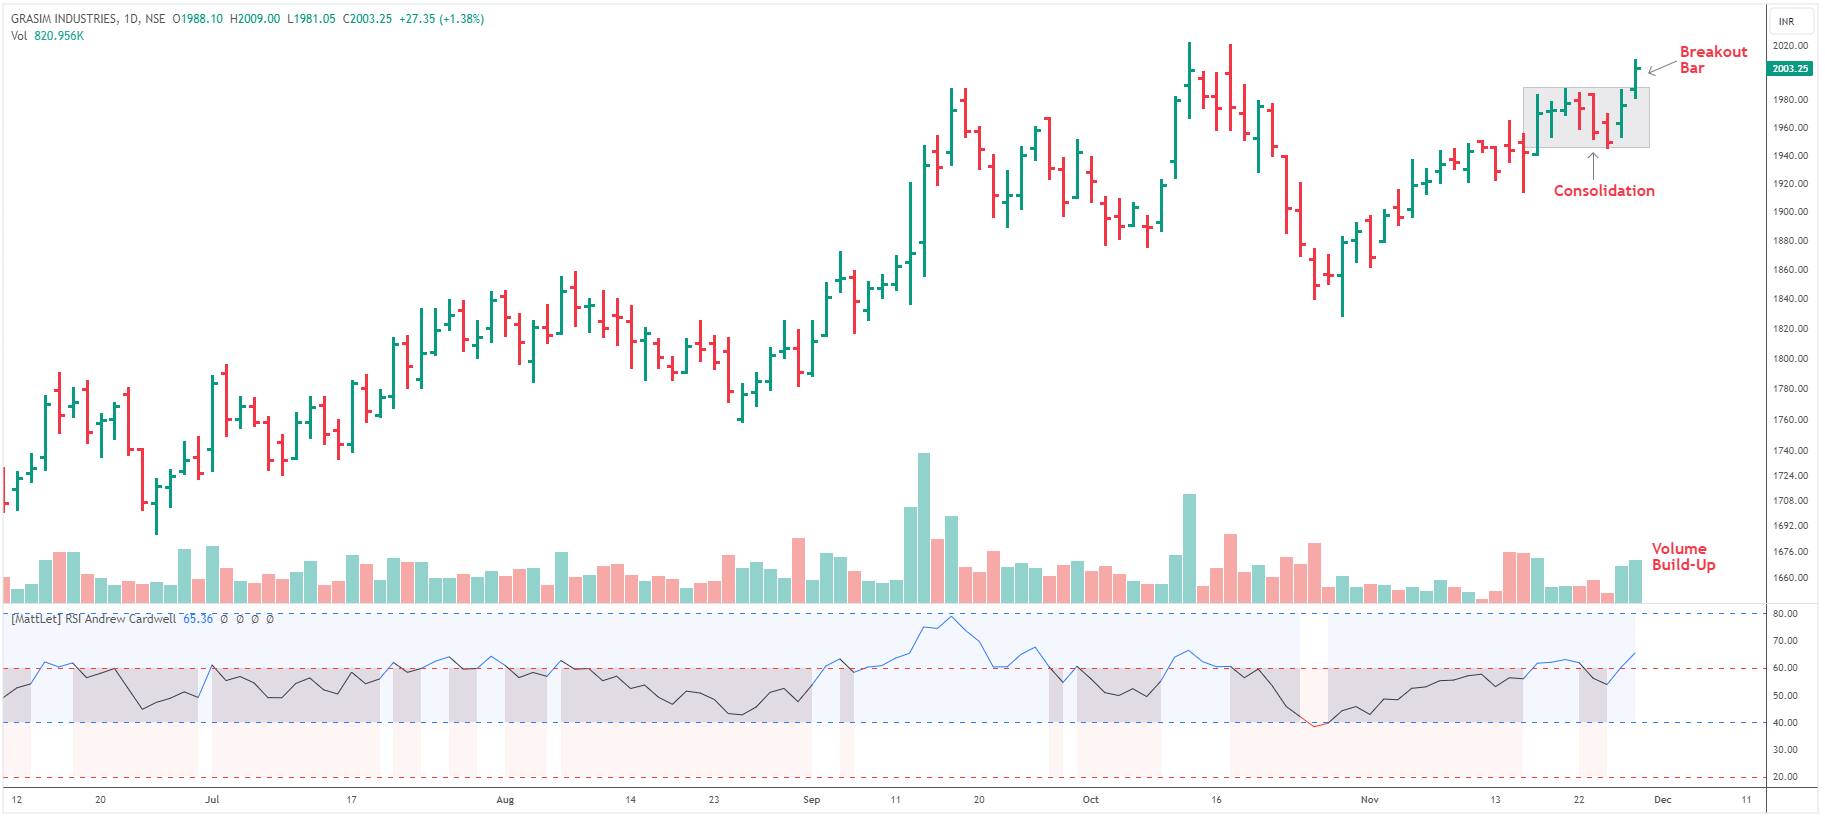 Technical Chart of Grasim Industries showing consolidation breakout | Source: SBI Securities
Derivative Data Analysis
On the derivative front, Shah highlights that long build-up is visible, as the November futures have surged by nearly 3 percent in the last two trading sessions. Meanwhile, the cumulative Open Interest (OI) of the current, next, and far series has surged by nearly 2 percent in the last two trading sessions. Discussing the option chain, the 2100 Call (CE) has the highest OI, while on the put side, the 1940 strike has the highest OI.
Based on the above observations, Shah expects the stock to continue its upward movement and test levels of Rs 2,100, followed by Rs 2,140 in the short-to-medium term. A stop-loss can be maintained at Rs 1940 on a closing basis.
Discover the latest Business News, Sensex, and Nifty updates. Obtain Personal Finance insights, tax queries, and expert opinions on Moneycontrol or download the Moneycontrol App to stay updated!
Find the best of Al News in one place, specially curated for you every weekend.
Stay on top of the latest tech trends and biggest startup news.


