


The week concluded on a positive note, marked by significant market activity. After falling nearly nine percent from its high, the market rebounded impressively, recovering the entire loss within the last three days. This dramatic 2,000-point rally saw Foreign Institutional Investors (FIIs) scrambling to cover their short positions.
Despite this recovery, FIIs still hold a substantial short position of 192,842 contracts in the futures market, down from the peak level of 355,379 contracts. This lingering short position suggests potential further upside in the market, as FIIs will need to cover their positions if the rally continues.
The market's bounce was fuelled by the Narendra Modi-led coalition securing a third term by surpassing the halfway mark. However, concerns about the government's stability over the next five years may lead to a reduction in the premium of Indian markets compared to global peers in the coming months.
Nonetheless, if the government succeeds in winning key state elections in the next few months, the market could gain more confidence and stability.
A likely correction
On weekly charts, Nifty bounced back from the 20-week average, though intra-week, all levels were broken. By the end of the week, it looked like a trend continuation, and the upward trend should continue despite short-term pullbacks.
While stocks and sectors are breaking out to new levels, it's important to note that certain sectors, such as the election-linked PSU stocks, may consolidate for longer. Metals are also over-bought, but they hold promise for the long term.
The Nifty should eventually stay above 23000 and head toward 23600, offering a positive outlook.
The daily swing is now at 92, indicating a short-term overbought condition (see chart Daily Swing) that can result in a pullback soon. The three-day bounce was very sharp and one-way. The daily range of Nifty has to normalise from 400 points to below 200 points before we can feel comfortable from a trading perspective.

Daily Swing
Source: web.strike.money
FIIs were short at the start of the week, and despite the strong rally, they have only covered a small portion of their shorts. Returning to extreme bullish optimism can take weeks, suggesting there is room for markets to go higher. In the chart below (FII Futures Position), you can sense that the recent low in positioning by FIIs is associated with important market bottoms from which it will go up for the next few months.
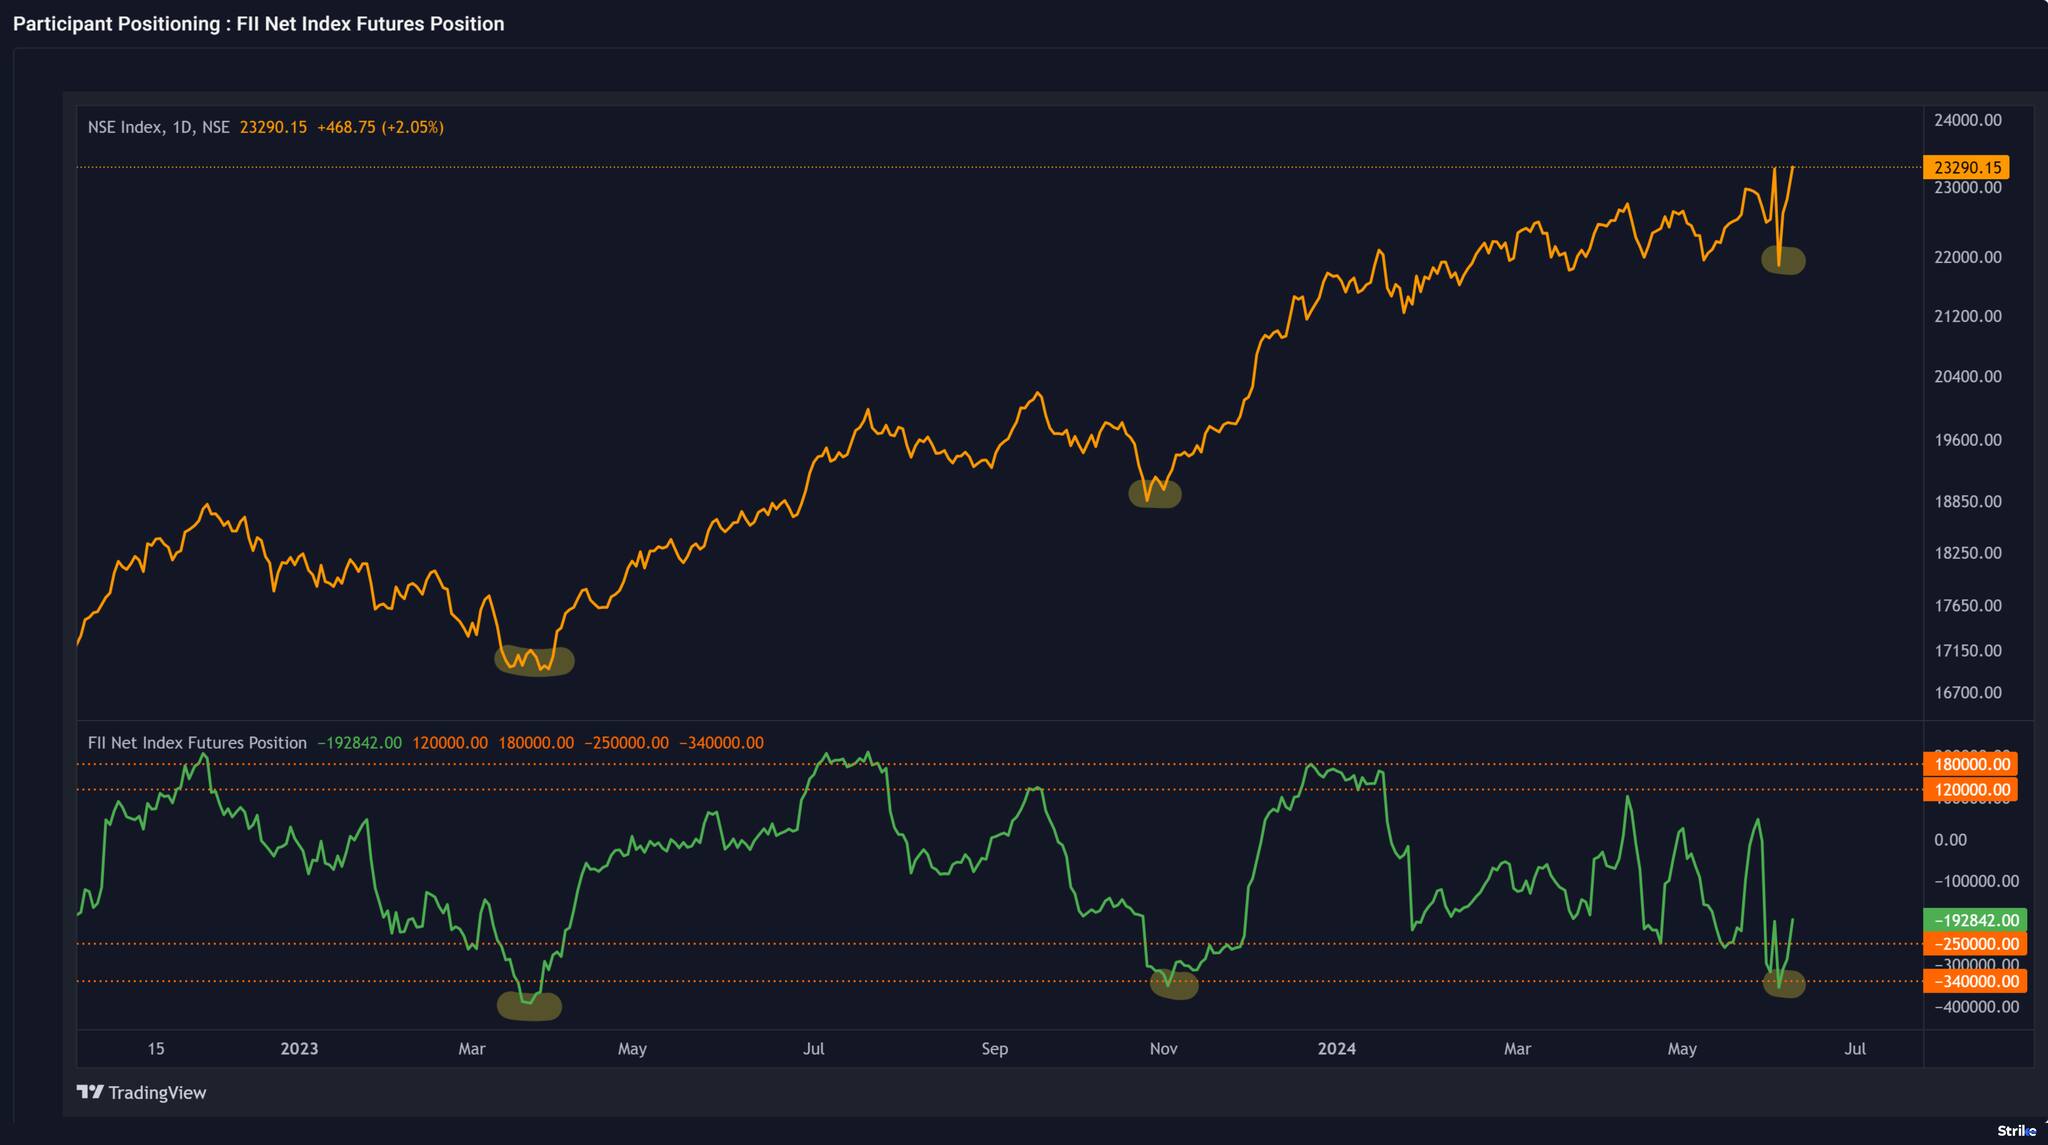
FII Futures Position
Source: web.strike.money
The Put/Call ratio (PCR) based on Open Interest is one indicator that enters the oversold zone even after the market has gone up sharply. The reason is that there was a lot of Call selling on the day of the fall, which resulted in the rising open interest on the Call side. In the chart below (Put/Call ratio), the indicator is a 9 Dema (Daily exponential moving average of 9 periods) of the PCR. It reflects the oversold condition with a lag. But the reading can be relevant for a while.
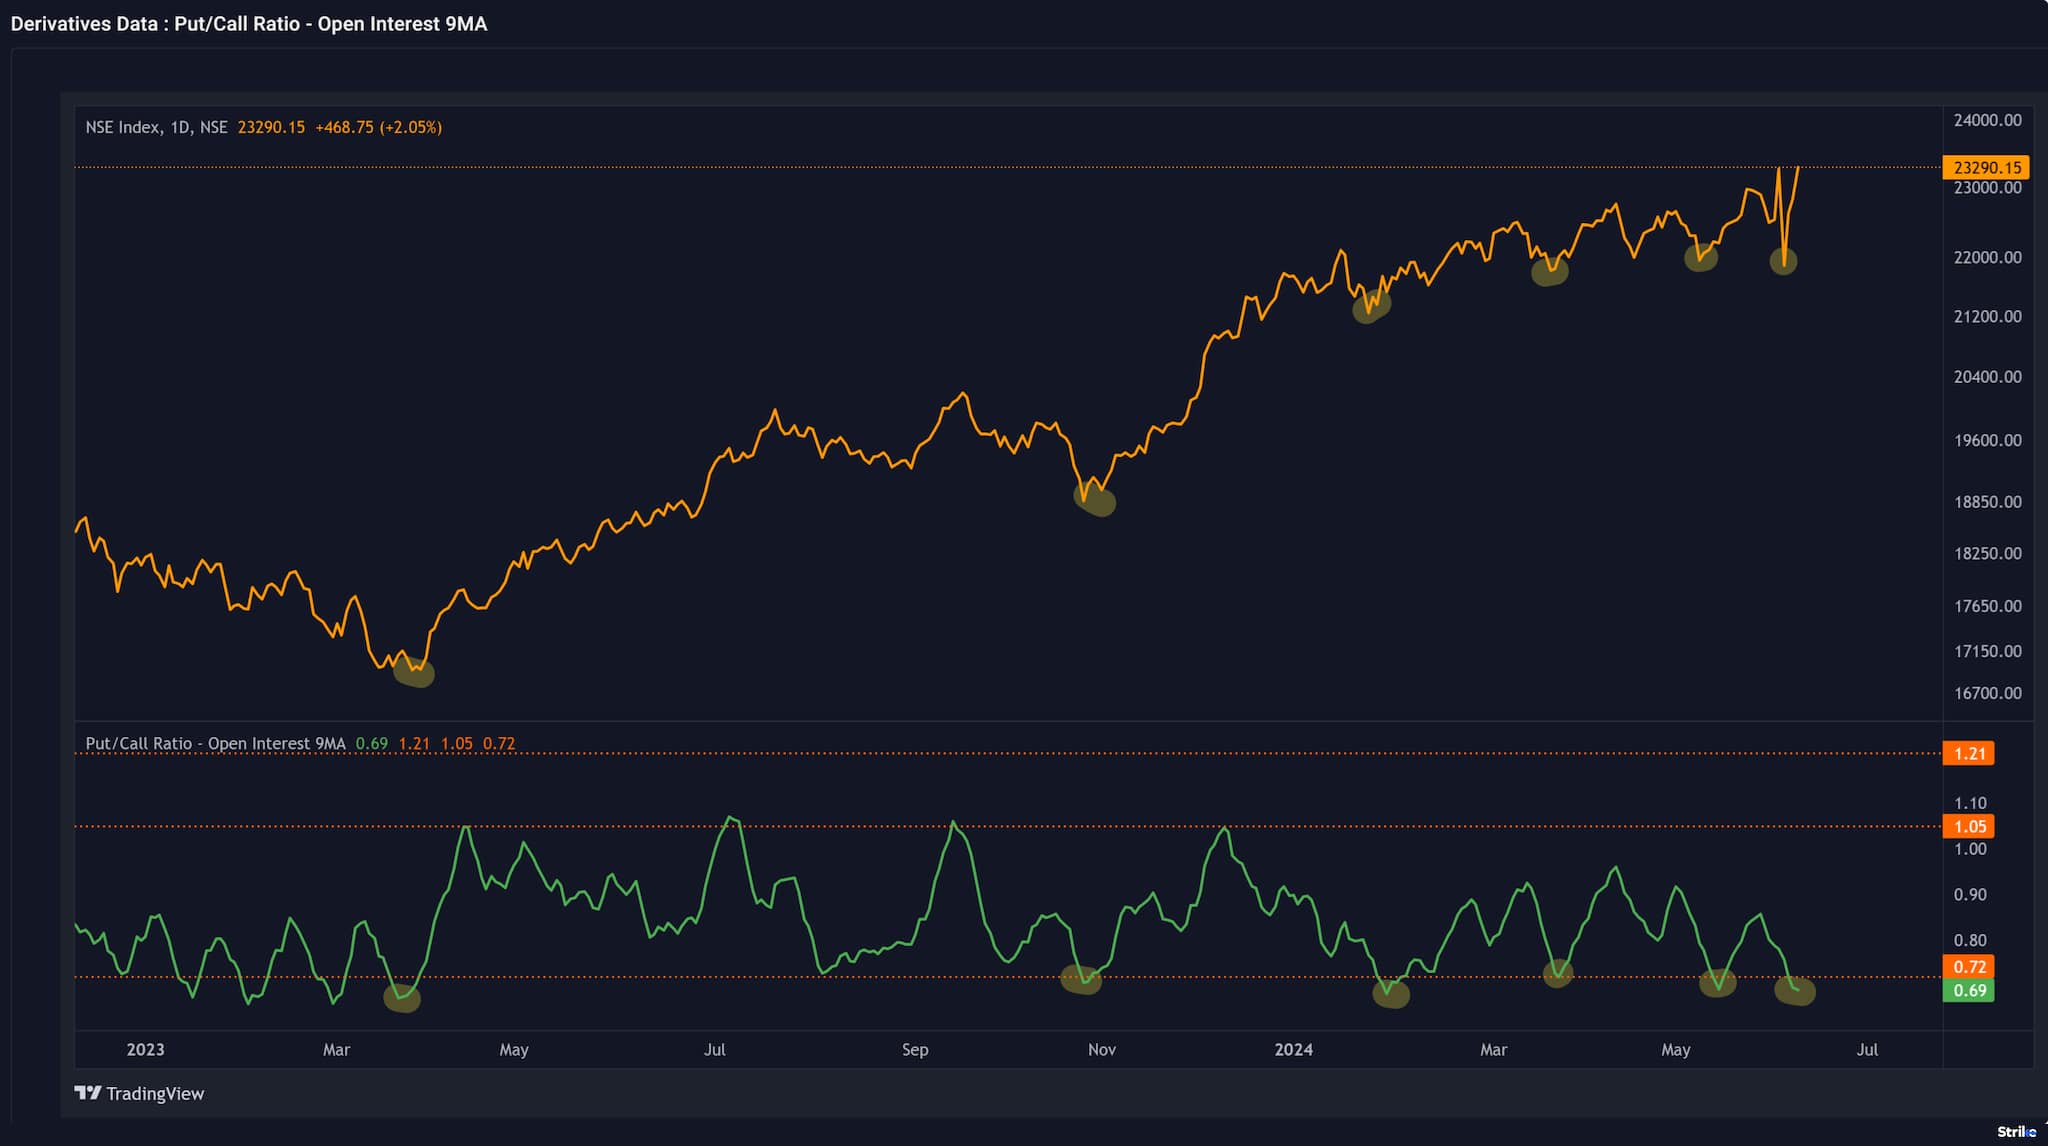
Put/Call ratio
Source: web.strike.money
The RRG (Relative Rotation Graphs) below show changes in sectoral strength. The chart shows that most sector indices declined in Relative Strength Ratio and Relative Strength Momentum. Among the sectors entering the lagging quadrant are Nifty Energy, Nifty Commodities, Nifty Oil & Gas, and Nifty PSU Bank. Sectors that have seen a run-up in momentum are Nifty IT, Healthcare, Pharma, and Private Bank.
The sectors that need to be closely watched are the Nifty FMCG, which is entering the Improving quadrant, and Bank Nifty and Nifty Financial Services, which entered the leading quadrant with gains in both Relative Strength Ratio and Relative Strength Momentum.

Relative Rotation Graphs
Source: web.strike.money
Indices and Market Breadth
A volatile week ended with the market closing near the high. The BSE Sensex touched an all-time high, while the Nifty is less than 20 points away from its highest point.
The broader market indices posted higher gains than the benchmark index.
IT was the top performing sector gaining 3.37 percent during the week followed by PSU, auto and infrastructure stocks.
During the week, Foreign institutional investors (FIIs) sold equities worth Rs 13,718.42 crore.
Among the stocks, Heritage Foods was the top performer, returning 64.12 percent in a week. It was followed by KCP, which shot up by 42.30 percent, and HOAC Foods, which returned 30.63 percent.
Among the top losers during the week were Veritaas, which fell 38.43 percent, JP Associate, which lost 29.45 percent, and CADSys, which lost 22.60 percent during the same period.
Global Markets
Most global markets closed the week higher as the European Central Bank announced a rate during the week. Euro Stoxx 600 posted a gain of 0.62 percent as the German and French markets gave a positive closing for the week. UK’s FTSE, however, closed lower, dropping 0.36 percent in the same period.
The S&P 500 touched a new high during the week, but a strong jobs report on Friday saw the US indices close lower. All three benchmark indices in the US closed in the green, with Nasdaq leading the pack with a gain of 2.36 per cent, followed by the S&P 500 closing 1.32 per cent higher. Dow Jones ended the week with a gain of 0.29 percent.
In addition to China, Asian markets joined the global rally led by Indian stocks. Hang Seng closed the week 1.59 per cent higher, and Nikkei 225 was up 0.45 per cent. Shanghai ended the week 1.15 percent lower.
Stocks to watch
Among the stocks expected to perform better during the week are Ultratech Cemco, Dr Lal Path Lab, Chola Finance, Cipla, UBL, Exide Industries, JSW Steel, Motherson, Maruti, and Muthoot Finance.
Cheers,Shishir Asthana

Discover the latest Business News, Sensex, and Nifty updates. Obtain Personal Finance insights, tax queries, and expert opinions on Moneycontrol or download the Moneycontrol App to stay updated!

Find the best of Al News in one place, specially curated for you every weekend.
Stay on top of the latest tech trends and biggest startup news.


