


Bears retained their power over Dalal Street for yet another session on December 16. The market maintained southward journey, tracking fall in global peers as growing recession fears and the hawkish tone by Federal Reserve weighed on the market sentiment.
The BSE Sensex declined 461 points to 61,338, and the Nifty50 fell 146 points to 18,269, while the broader markets were traded in line with benchmarks as the Nifty Midcap 100 and Smallcap 100 indices dropped 1.6 percent, and 0.6 percent respectively.
The volatility index India VIX was up by 2.5 percent on Friday, and also spiked significantly by 23 percent from weekly low of 11.43 to 14.07 levels, making the trend uncomfortable for bulls.
But stocks that bucked the trend and reported nice show on Friday included EPL which surged nearly 14 percent to Rs 191, the highest closing level since March 31 this year and formed robust bullish candle on the daily charts with significantly higher volumes. The stock has seen a decisive breakout of long downward sloping resistance trend line adjoining July 5, 2021, and December 13, 2022, and also there was a breakout of horizontal resistance trend line adjoining June 7 and September 30 this year.
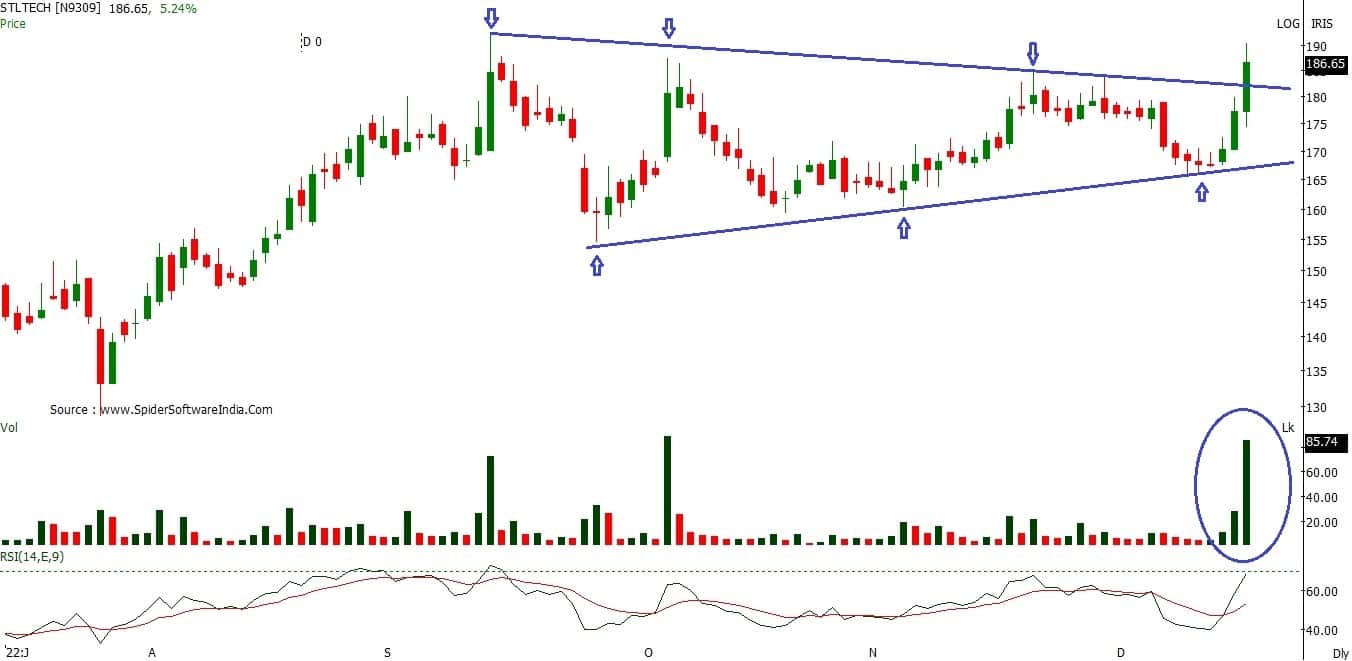
Sterlite Technologies shares gained more than 5 percent to Rs 186.65, the highest closing level since May 2, 2022 and formed long bullish candle on the daily charts with strong volumes, making higher highs higher lows for third consecutive session. It has seen a breakout of long downward sloping resistance trend line adjoining April 22 and November 30 this year.
Kalyan Jewellers India was also in focus, rising 5.5 percent to end at record closing high of Rs 125.45. The stock has formed big bullish candle on the daily charts with robust volumes. Also there was a breakout of small downward sloping resistance trend line adjoining December 13 and December 15, 2022.
Here's what Rajesh Palviya of Axis Securities recommends investors should do with these stocks when the market resumes trading today:
Since past one year, the stock has been consolidating within the "Descending Triangle" representing strong consolation. However with current week's strong upmove the stock has decisively broken out its trend reversal pattern at Rs 177 levels on a weekly closing basis. This breakout is accompanied with huge volumes indicating increased participation.
This buying was observed from 200-day SMA (simple moving average - Rs 165) which remains a crucial support zone. The daily, weekly, monthly strength indicator RSI (relative strength index) is in bullish mode and sustaining above 50 mark indicating sustained strength across all the time frames.
The daily and weekly "band Bollinger" buy indicates increased momentum. On the weekly basis, the change of trend has been confirmed on a closing basis.
Investors should buy, hold and accumulate this stock with an expected upside of Rs 210-230 and with downside support zone of Rs 175-165 levels.

On the daily timeframe, the stock has confirmed a "symmetrical triangle" breakout at Rs 182 levels along with huge volumes indicating increased participation. This pattern confirmation signals continuation of prior upmove.
The stock is sustaining above 20, 50, 100 and 200-day SMA which reconfirms bullish trend. The daily "band Bollinger" buy indicates increased momentum.
The daily, weekly, monthly strength indicator RSI is in bullish mode indicating sustained strength across all the time frames.
Investors should buy, hold and accumulate this stock with an expected upside of Rs 210-220 and with downside support zone of Rs 174-165 levels.
The stock is in strong uptrend across all the time frame forming a series of higher tops and bottoms. The stock is sustaining above 20, 50, 100 and 200-day SMA which reconfirms bullish trend.
Rising volumes along with the rising prices interprets increasing participation in a rally. The daily, weekly, monthly strength indicator RSI is in bullish mode indicating sustained strength across all the time frames.
Investors should buy, hold and accumulate this stock with an expected upside of Rs 140-155, with downside support zone of Rs 115-105 levels.

Disclaimer: The views and investment tips expressed by investment experts on Moneycontrol.com are their own and not those of the website or its management. Moneycontrol.com advises users to check with certified experts before taking any investment decisions.
Discover the latest Business News, Sensex, and Nifty updates. Obtain Personal Finance insights, tax queries, and expert opinions on Moneycontrol or download the Moneycontrol App to stay updated!
Find the best of Al News in one place, specially curated for you every weekend.
Stay on top of the latest tech trends and biggest startup news.


