


The benchmark indices continued their record-high streak despite volatility on August 30, with 1,366 shares advancing and 985 shares declining on the NSE. The market may consolidate before showing further upward movement in the coming sessions. Below are some trading ideas for the near term:
Nagaraj Shetti, Senior Technical Research Analyst at HDFC Securities
Rail Vikas Nigam | CMP: Rs 607.4
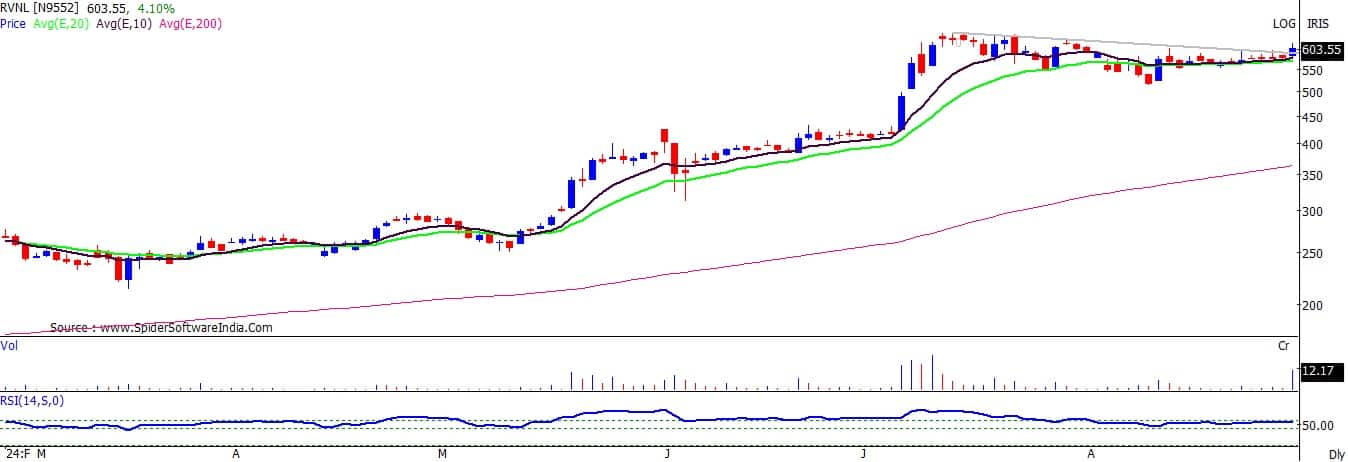
The weekly timeframe chart of RVNL indicates an attempt at an upside breakout from its weekly range movement. The stock price is currently trying to break out decisively from a down-sloping trendline and a narrow range on the daily chart around Rs 600-610 levels. Volume has started to expand during this upside breakout, and the daily RSI (Relative Strength Index) shows a positive indication.
Strategy: Buy
Target: Rs 665
Stop-Loss: Rs 570
Radico Khaitan: Rs 1,942
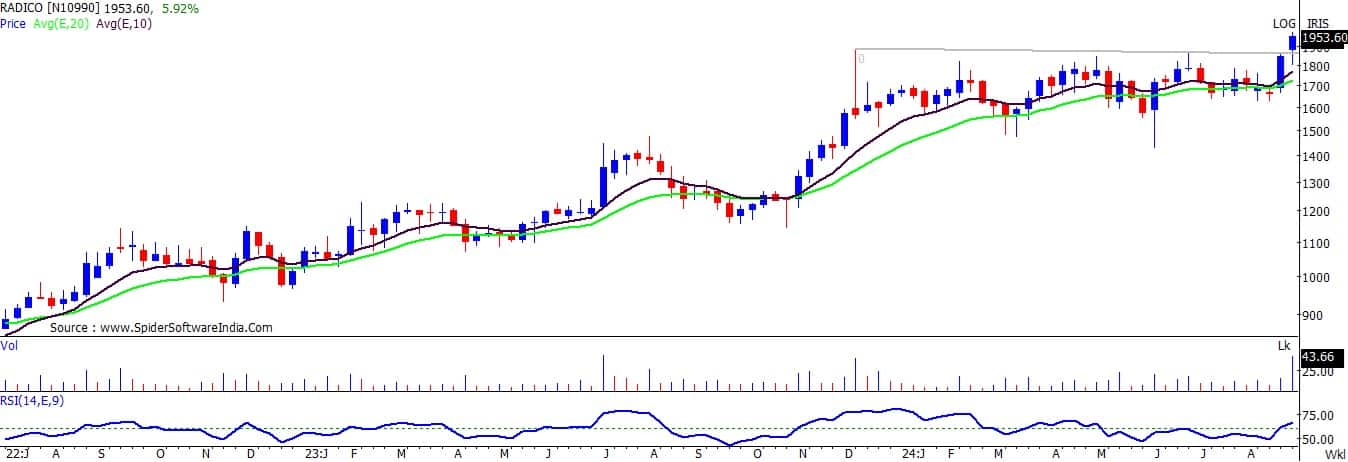
After moving into a larger high-low range over the last 4-5 months, Radico Khaitan's price is now attempting a decisive breakout of this range at Rs 1,880-1,900 levels. Following a sustainable upmove in the previous week, the stock has continued its upward momentum and closed above the hurdle. Volume has started to expand during this breakout, and the weekly RSI has moved above the crucial upper 60 level.
Strategy: Buy
Target: Rs 2,155
Stop-Loss: Rs 1,870
Oberoi Realty | CMP: Rs 1,772

The consolidation movement of the past month in Oberoi Realty seems to be ending soon. The stock price is now on the verge of breaking above the upper band around Rs 1,800. It has been trading above the key lower support of the 20-week EMA (Exponential Moving Average) and has moved above the immediate resistance of the 10-week EMA for the past week. Volume and RSI patterns are indicating a positive bias for the stock price ahead.
Strategy: Buy
Target: Rs 1,960
Stop-Loss: Rs 1,685
Rajesh Palviya, Senior Vice President Research (Head Technical Derivatives) at Axis Securities
Gujarat State Petronet | CMP: Rs 442.6
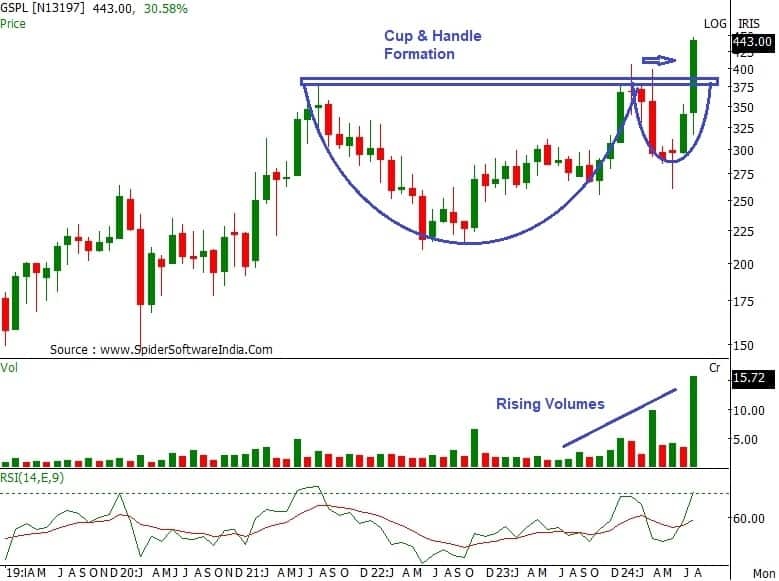
Since August 2021, Gujarat State Petronet (GSPL) has been consolidating within a "Cup & Handle" formation. With this month's 30 percent price hike, the stock has decisively broken out of the pattern at Rs 395 on a monthly closing basis. This breakout is accompanied by high volumes, indicating increased momentum. The stock has recently recaptured its 20, 50, 100, and 200-day SMA (Simple Moving Average) and rebounded sharply, reconfirming a bullish trend. The daily, weekly, and monthly "Band Bollinger" buy signals show increased momentum. The RSI across all time frames is in positive territory, justifying rising strength. Investors should buy, hold, and accumulate this stock with an expected upside of Rs 485-585, with a downside support zone of Rs 410-390 levels.
Strategy: Buy
Target: Rs 485, Rs 585
Stop-Loss: Rs 410
Glenmark Pharmaceuticals | CMP: Rs 1,731.75

Glenmark is in a strong uptrend across all time frames, showing bullish sentiment. The stock is well above its 20, 50, 100, and 200-day SMA, which are also rising along with the price, reaffirming the bullish trend. The daily, weekly, and monthly RSI indicators are in positive territory, reflecting rising strength. The stock is trending higher in an "up-sloping Channel," which supports sustained strength and trend. Investors should buy, hold, and accumulate this stock with an expected upside of Rs 1,800-1,885, with a downside support zone of Rs 1,675-1,575 levels.
Strategy: Buy
Target: Rs 1,800, Rs 1,885
Stop-Loss: Rs 1,675
Rajesh Bhosale, Technical Analyst at Angel One
UPL | CMP: Rs 598.35

On the weekly chart, UPL has confirmed a bullish reversal pattern known as the ‘Inverse Head and Shoulders.’ This pattern was validated on Friday with strong volumes and a bullish candle, marking a breakaway gap. Additionally, the stock closed above the 89-week EMA, which had previously acted as significant resistance but now suggests a shift in polarity. The RSI on the weekly chart has also moved past the 60 mark, a level it has struggled to surpass for over 18 months, indicating a potential shift in momentum to the upside. Hence, we recommend buying UPL around Rs 598 - Rs 595.
Strategy: Buy
Target: Rs 650
Stop-Loss: Rs 571
Home First Finance Company India | CMP: Rs 1,153
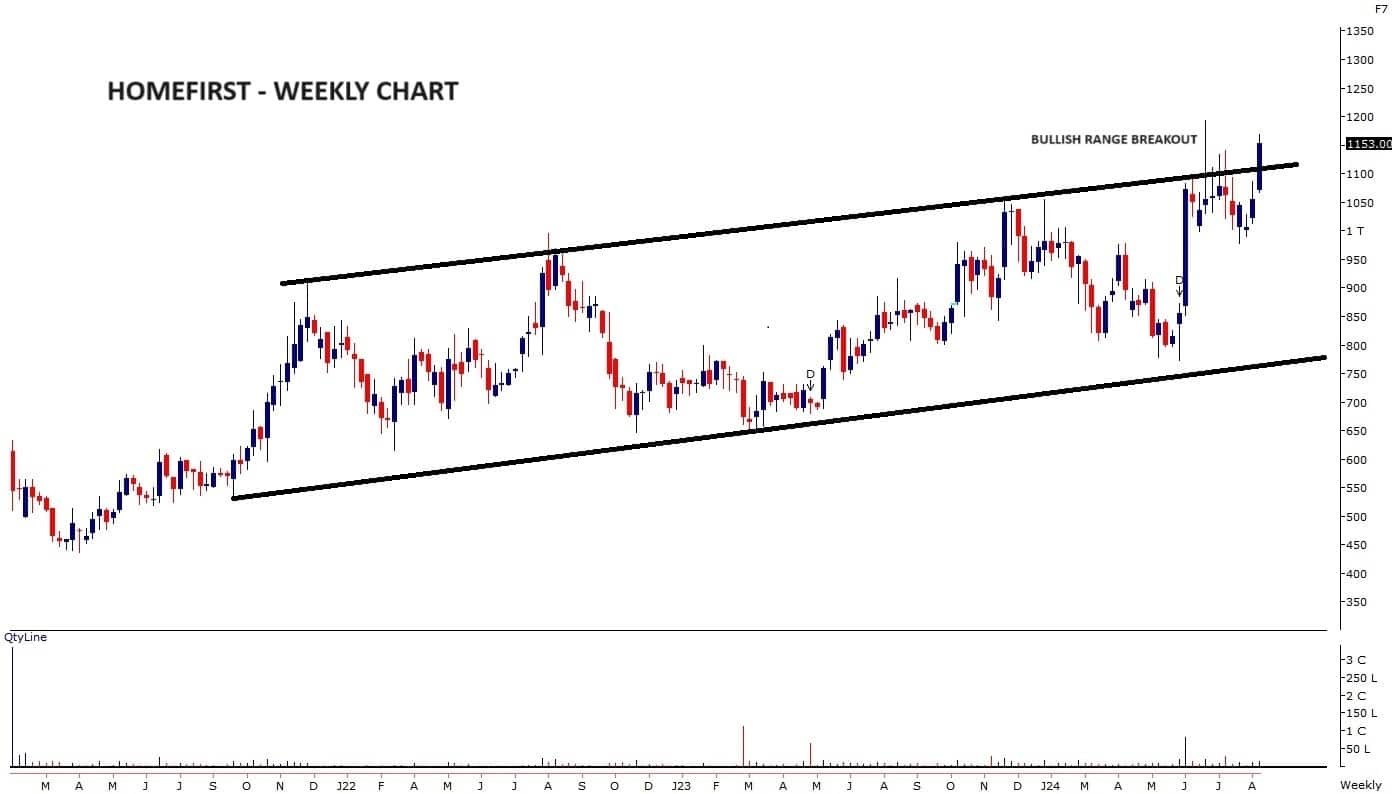
Following a sharp rise from Rs 770 to Rs 1,100 in June, prices entered a period of time-wise correction. However, they have now resumed their primary uptrend by breaking out of this congestion zone. Volume activity, which was subdued during the correction, has picked up, confirming the validity of the breakout. With the highest weekly closing recorded, we anticipate that the positive momentum will continue in the near term. Hence, we recommend buying Home First Finance Company around Rs 1,153 - Rs 1,145.
Strategy: Buy
Target: Rs 1,250
Stop-Loss: Rs 1,098
Jigar S Patel, Senior Manager - Equity Research at Anand Rathi
Som Distilleries and Breweries | CMP: Rs 112.2
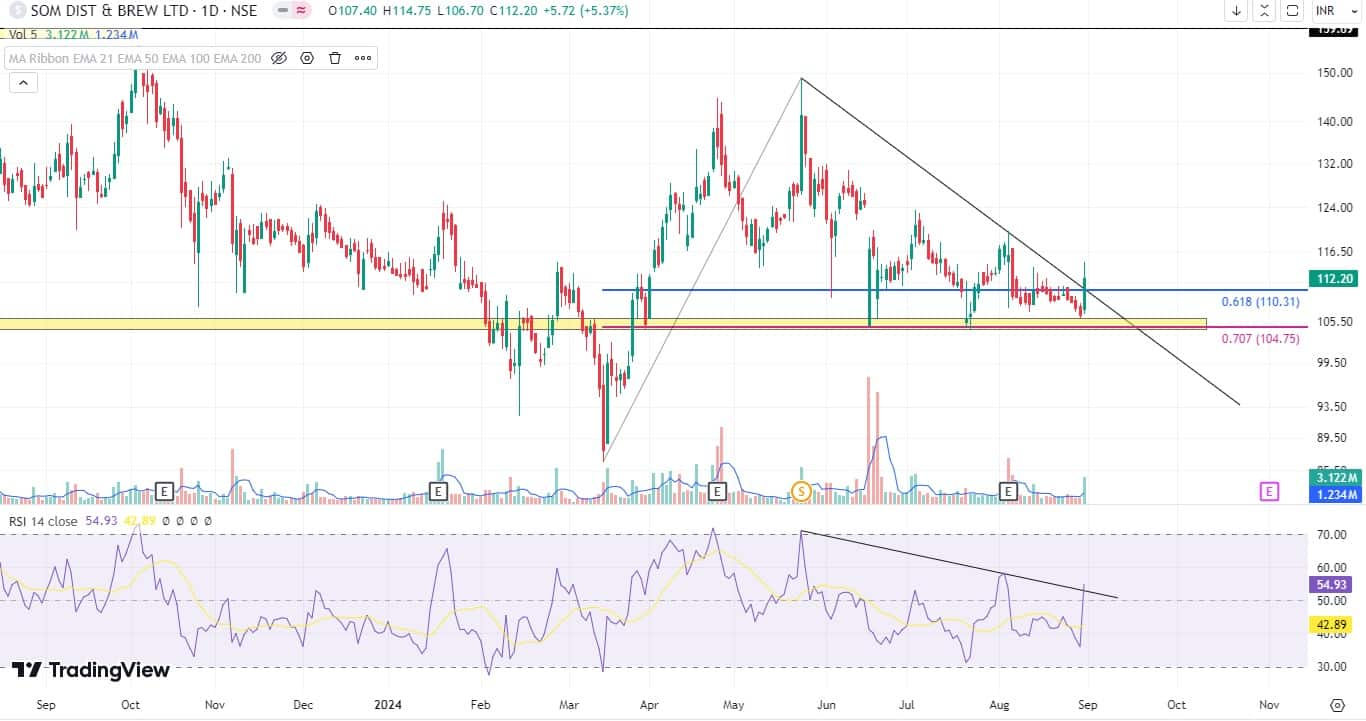
Som Distilleries reached a peak of approximately Rs 149 in May 2024. Since then, the stock has experienced a significant decline, losing about 29 percent in price. This sharp drop brought the stock down to a critical support level, forming a triple bottom pattern within the range of Rs 105-108. The triple bottom pattern, occurring at a previous demand zone, is often considered a bullish signal, suggesting that the stock has found strong support at these levels and may be poised for a reversal.
In the most recent trading session, the stock saw a surge in trading volume, indicating renewed investor interest. The price action in this session was strong enough to break through a 3-4 month-long bearish trendline, signaling a potential shift from a downtrend to an uptrend. Additionally, a similar trendline violation has been observed in the RSI on the daily chart, further confirming the bullish momentum. These technical developments make the stock an attractive buy candidate at current levels. Based on this analysis, we recommend going long in the price range of Rs 110-114, targeting Rs 128. To manage risk, a stop-loss should be placed at Rs 104 on a daily closing basis, ensuring protection against any further downside.
Strategy: Buy
Target: Rs 128
Stop-Loss: Rs 104
Hikal | CMP: Rs 329.3

Between March 2023 and June 2024, Hikal was in a consolidation phase, trading within a relatively narrow range of Rs 260 to Rs 320. This prolonged consolidation period suggests that the stock was in a phase of accumulation, where neither buyers nor sellers had the upper hand. However, the stock eventually broke out of this range, supported by significant trading volume, which is often a strong indicator of a shift in market sentiment towards bullishness.
Following this breakout, Hikal rallied by nearly Rs 40, underscoring the strength of the breakout. Despite this rally, the recent correction in the stock price presents a renewed buying opportunity.
From a technical perspective, the weekly Ichimoku base line is now acting as a crucial support level, aligning closely with the breakout range. This confluence of support levels suggests that the stock is well-positioned for further upside, making it a compelling buy. Given these technical indicators, it is advisable to buy Hikal within the price range of Rs 325 to Rs 335. The stock shows potential for an upside target of Rs 400, which represents a significant gain from current levels. To manage downside risk, a stop-loss should be placed at Rs 295 on a daily closing basis, ensuring that any potential losses are limited if the stock fails to hold its support levels.
Strategy: Buy
Target: Rs 400
Stop-Loss: Rs 295
Patel Engineering | CMP: Rs 57.21

After reaching a peak around the Rs 70 mark in July 2024, Patel Engineering experienced a notable correction, losing 27 percent from its recent high. This sharp pullback brought the stock down to a critical support level, located within the demand zone of Rs 50-53, a level that previously acted as a strong support during its prior uptrend.
At this crucial support level, a bullish BAT pattern has emerged—a harmonic pattern known for signaling potential bullish reversals. The bullish bat pattern is typically formed when the price action retraces to specific Fibonacci levels, indicating that the stock is poised for a reversal from its recent decline. The emergence of this pattern, combined with the stock finding support at a key demand zone, creates a strong confluence of technical indicators pointing towards a potential upward move. Given these favourable technical signals, the current price levels are considered attractive for buying. Therefore, it is recommended to buy the stock within the Rs 55-58 range, with a target of Rs 68. To manage risk and protect against further downside, a stop-loss should be placed near Rs 51 on a daily closing basis.
Strategy: Buy
Target: Rs 68
Stop-Loss: Rs 51
Disclaimer: The views and investment tips expressed by investment experts on Moneycontrol.com are their own and not those of the website or its management. Moneycontrol.com advises users to check with certified experts before taking any investment decisions.
Discover the latest Business News, Sensex, and Nifty updates. Obtain Personal Finance insights, tax queries, and expert opinions on Moneycontrol or download the Moneycontrol App to stay updated!