


The market recorded a recovery of nearly 200 points from the day's low and closed with marginal gains on the Nifty 50 on June 24. About 1,176 shares declined, and 1,161 shares advanced on the NSE. If the bulls continue their support, the index is likely to hit a record high of 23,667 in the coming days, with support at 23,300. Here are some trading ideas for the near term:
Pravesh Gour, Senior Technical Analyst at Swastika Investmart
Trent | LTP: Rs 5,395.75
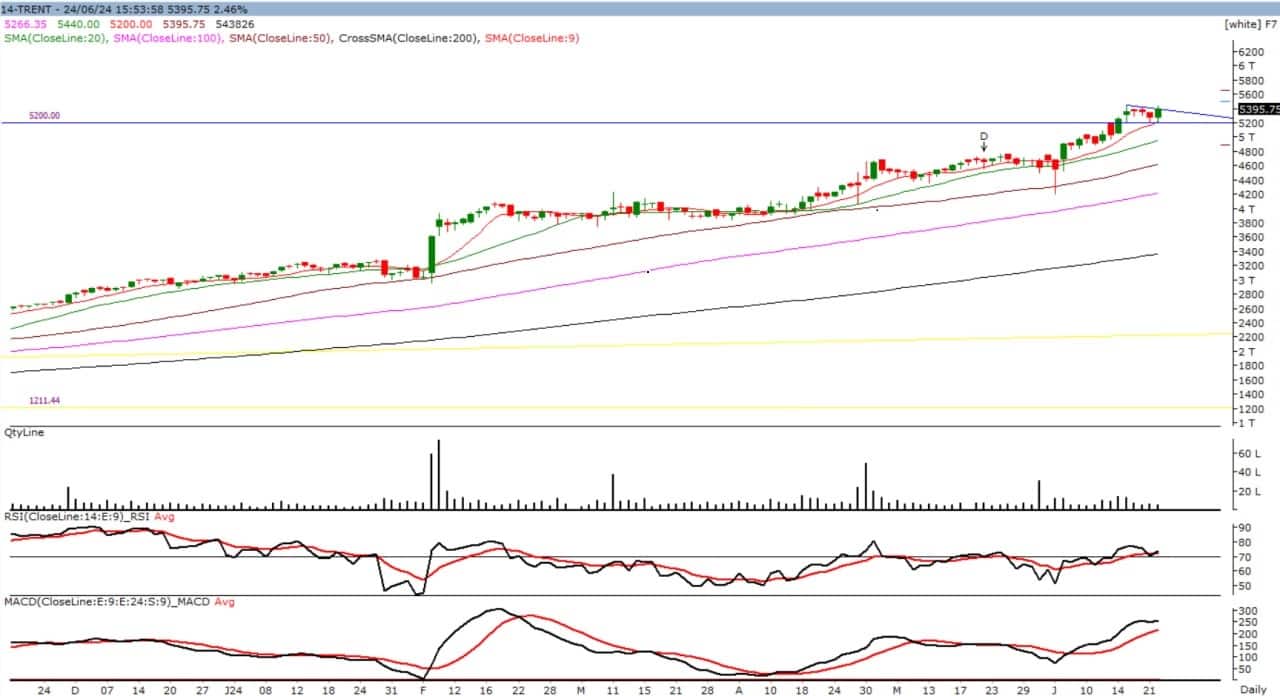
Trent is in a classical uptrend, with higher highs and higher lows. On the daily chart, it also saw a breakout of a Flag formation with strong volume. The structure of the counter is very bullish, as it trades above all important moving averages. It has broken a neckline at around Rs 5,400-5,420 levels on the daily chart. The momentum indicators are positively placed. On the upside, Rs 5,800 is the important psychological resistance level, above which we can expect Rs 6,100+ levels in the near term, while on the downside, Rs 4,900 is the support level.
Strategy: Buy
Target: Rs 6,144
Stop-Loss: Rs 4,900
HG Infra Engineering | LTP: Rs 1,823.45
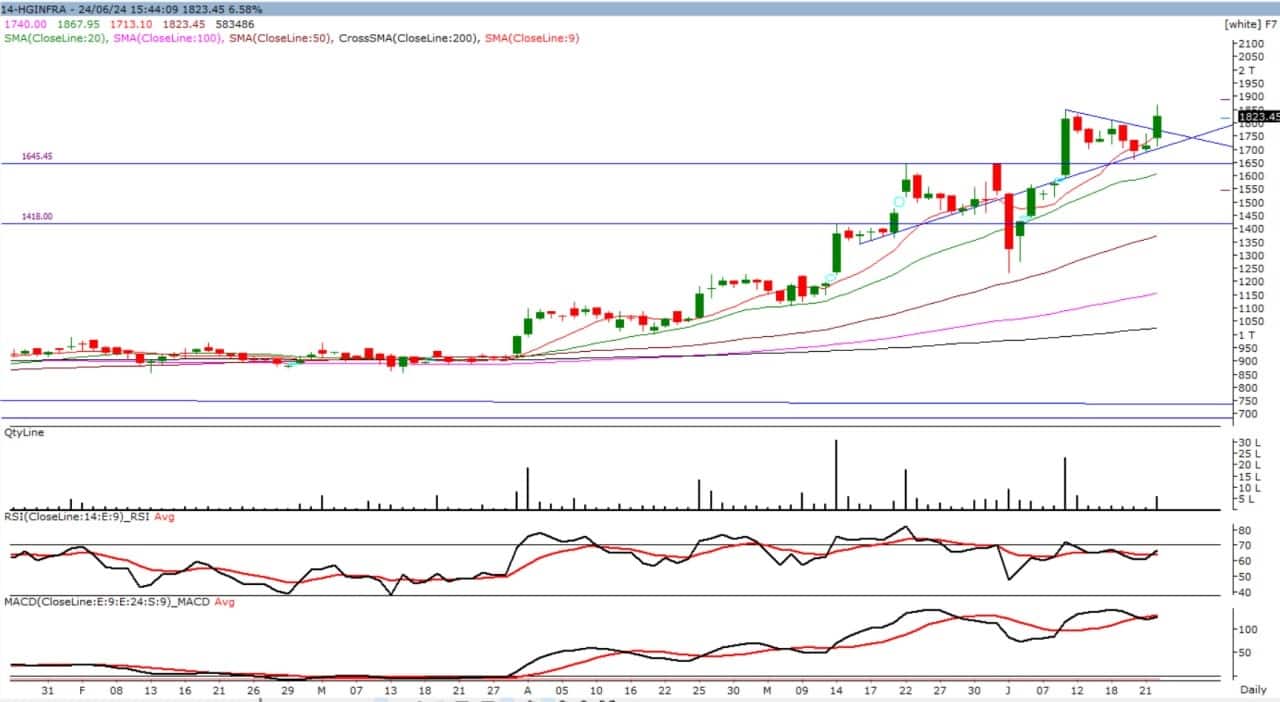
HG Infra has established a pattern of higher highs and higher lows on the weekly chart. On the daily chart, it has experienced a V-shaped recovery from the last breakout level at Rs 1,650, initiating a new rally towards Rs 2,000. The overall structure is very attractive, as the counter is trading above all its important moving averages. The momentum indicators are also favourable as the RSI (Relative Strength Index) is positively positioned, and the MACD (Moving Average Convergence Divergence) supports the current strength. On the upside, Rs 2,000 is a significant psychological level, and surpassing this could lead to a move towards Rs 2,050+. On the downside, a cluster of moving averages around Rs 1,650 serves as a strong demand zone during any correction.
Strategy: Buy
Target: Rs 2,078
Stop-Loss: Rs 1,650
Likhitha Infrastructure | LTP: Rs 480

Likhitha Infrastructure is showing classical bullish momentum and forming a Flag pattern on the daily chart. The overall structure is highly attractive, trading above all its moving averages. Momentum indicators also support the positive outlook as the RSI is favourably positioned, and the MACD is reinforcing the current strength. On the upside, Rs 500 is the immediate resistance, and breaking this level could lead to a rise towards Rs 550 in the near term. On the downside, Rs 440 is a key support level in case of any correction.
Strategy: Buy
Target: Rs 548
Stop-Loss: Rs 440
RailTel Corporation of India | LTP: Rs 495

RailTel Corporation has witnessed a breakout of an ascending triangle formation with strong volume on the longer timeframe. It is in higher highs & higher lows formation. The overall structure is very lucrative as it trades above its all-important moving averages. On the upside, Rs 540 is an immediate resistance area; above this, we can expect a run-up towards Rs 564+ levels in the near term. On the downside, Rs 450 is major support for any correction. The momentum indicator RSI is also positively poised, while MACD is supporting the current strength.
Strategy: Buy
Target: Rs 564
Stop-Loss: Rs 450
Mehul Kothari, DVP – Technical Research at Anand Rathi
Rattanindia Enterprises | LTP: Rs 85

In the year 2023, Rattanindia Enterprises confirmed a major breakout from the Rounding Bottom formation. The theoretical target for the same was around Rs 100 and more. Then after the stock went into a consolidation phase and during this period, the stock retested its 200 DEMA (Days Exponential Moving Average) again and again. Finally, we are witnessing a fresh breakout which indicates that the stock can reach three digits in a few months. Thus, traders are advised to buy Rattanindia Enterprises near Rs 84 for a target of Rs 105 in the coming 3 – 6 weeks
Strategy: Buy
Target: Rs 105
Stop-Loss: Rs 75
Kajaria Ceramics | LTP: Rs 1,399.75
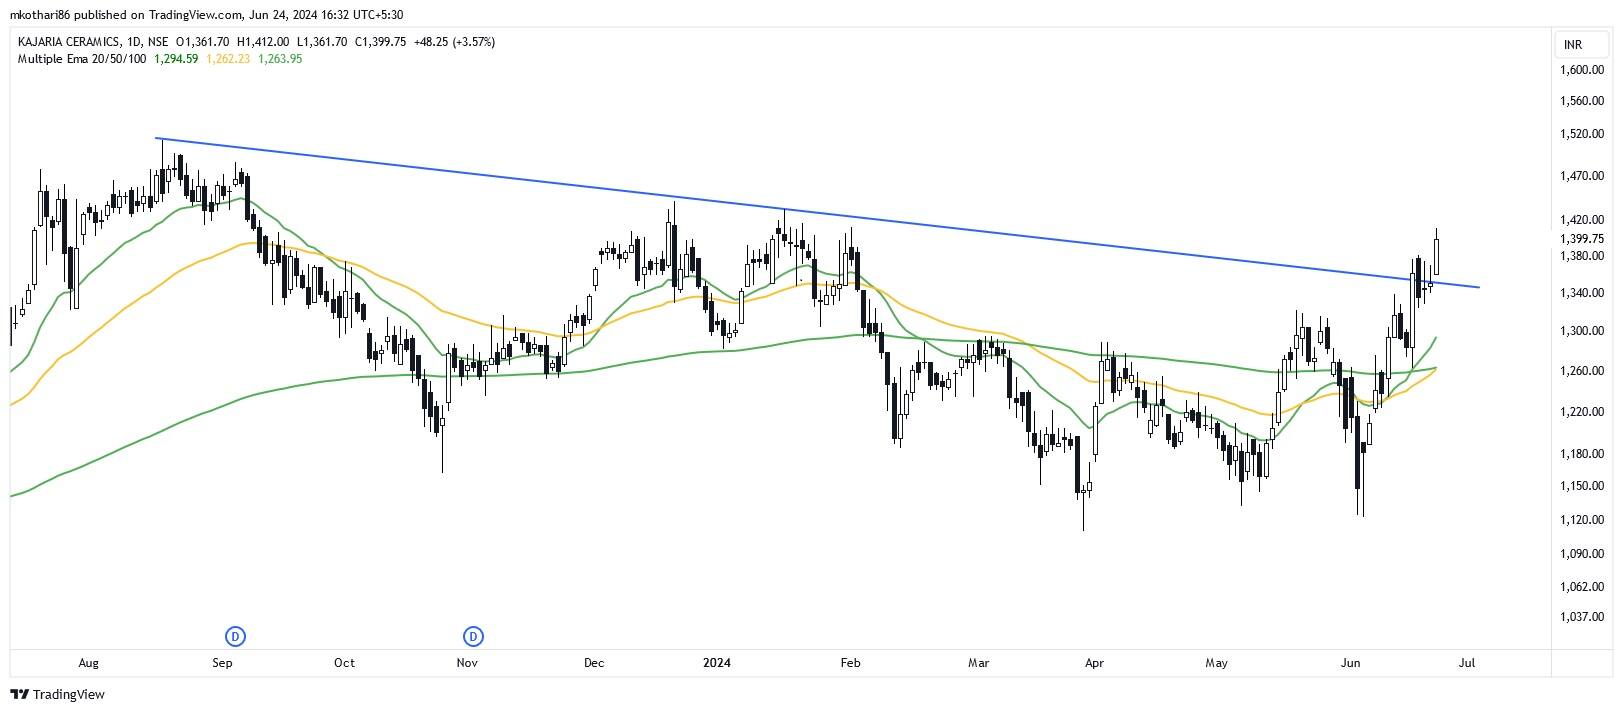
A few days back, Kajaria Ceramics confirmed a breakout from the falling trendline on the daily chart. The stock then went sideways for a few trading sessions without any significant upside. Now finally, there is a fresh breakout which has resulted in a bullish Flag pattern. Since this is a continuation pattern, we expect further upside in the coming sessions. Thus, traders are advised to buy Kajaria Ceramics in the range of Rs 1,400-1,380 for a target of Rs 1,500 in the coming 2 – 3 weeks.
Strategy: Buy
Target: Rs 1,500
Stop-Loss: Rs 1,320
Jay Thakkar, Vice President & Head of Derivatives and Quant Research at ICICI Securities
Can Fin Homes | LTP: Rs 883

Can Fin Homes has provided a breakout from the falling trendline, and with that, it has also provided a breakout from the sideways consolidation with a bullish crossover in its momentum indicators, which is a bullish sign in the near term. The stock has been forming higher tops and higher bottoms, thus indicating a trend continuation on the upside.
Strategy: Buy
Target: Rs 925, Rs 940
Stop-Loss: Rs 848
Dabur India | LTP: Rs 599.75
Dabur has provided a breakout from a sideways consolidation, and the breakout has come with an increase in volumes as well as a bullish crossover in its momentum indicators. The stock has recently seen some profit booking from the higher levels; however, it has found good support at the lower levels, making it a good buying opportunity at the lower levels. The momentum indicator MACD is still well in the buy mode both on the daily as well as weekly charts.
Strategy: Buy
Target: Rs 630, 645
Stop-Loss: Rs 581
Gujarat Gas | LTP: Rs 607.8

Gujarat Gas has broken out from the sideways consolidation with an increase in volumes as well as a bullish crossover in its momentum indicator MACD on the daily as well as weekly charts. The stock has retested the breakout level and reversed on the upside quite sharply, hence the overall trend still remains bullish.
Strategy: Buy
Target: Rs 635, Rs 655
Stop-Loss: Rs 594
Disclaimer: The views and investment tips expressed by investment experts on Moneycontrol.com are their own and not those of the website or its management. Moneycontrol.com advises users to check with certified experts before taking any investment decisions.
Discover the latest Business News, Sensex, and Nifty updates. Obtain Personal Finance insights, tax queries, and expert opinions on Moneycontrol or download the Moneycontrol App to stay updated!
Find the best of Al News in one place, specially curated for you every weekend.
Stay on top of the latest tech trends and biggest startup news.


