


The southward journey in the market continued for another session, with the benchmark indices closing the volatile session with marginal losses on November 8. The market breadth remained in favour of the bears, with 1,762 shares declining compared to 718 rising shares on the NSE. The market is likely to trade with a negative bias amid ongoing consolidation. Below are some trading ideas for the near term:
Osho Krishan, Senior Analyst - Technical & Derivative Research at Angel One
Aster DM Healthcare | CMP: Rs 438

Aster DM Healthcare is on a promising long-term upward trajectory, consistently achieving higher highs and higher lows across various time frames. Recently, the stock demonstrated a strong bullish gap, showcasing its ability to maintain a position above all major EMAs (Exponential Moving Averages) on the daily chart, which supports a positive outlook. Furthermore, the technical indicators are aligned favourably, suggesting that the uptrend is well-positioned to continue in the near future. This encouraging trend reflects the stock's resilience and potential for further growth. Hence, we recommend buying Aster DM Healthcare around Rs 430-420.
Strategy: Buy
Target: Rs 460, Rs 465
Stop-Loss: Rs 405
Latent View Analytics | CMP: Rs 496

Latent View Analytics has undergone a corrective phase from the highs of Rs 575, falling below its 200-day SMA (Simple Moving Average) on the daily time frame chart, which coincides with the historical support zone. In the last couple of trading sessions, the stock has shown initial signs of reversal from the oversold zone, backed by robust volumes. Such developments have historically signaled a trend reversal for the stock. Additionally, on the oscillator front, the MACD (Moving Average Convergence Divergence) has exhibited a positive crossover, providing a bullish outlook for the stock. Hence, we recommend buying Latent View Analytics around Rs 490-485.
Strategy: Buy
Target: Rs 542
Stop-Loss: Rs 458
Tata Consultancy Services | CMP: Rs 4,147

TCS has recently experienced a phase of profit booking after reaching its peak of Rs 4,580 and is currently approaching the 200 SMA on the daily chart. Historically, this level has proven to be solid support, often prompting a reversal in the stock's trend. At present, TCS is finding support near its 20 DEMA, which aligns with the 50 percent Fibonacci retracement level of its recent rally. This suggests a promising opportunity for a rebound from its corrective phase. Furthermore, the recent upward momentum is reinforced by a 'Bullish Engulfing' candlestick pattern on the weekly chart, indicating that the stock is well-positioned to continue its upward journey in the near future. Hence, we recommend buying TCS around Rs 4,140-4,120.
Strategy: Buy
Target: Rs 4,400
Stop-Loss: Rs 3,980
Nagaraj Shetti, Senior Technical Research Analyst at HDFC Securities
National Fertilizers | CMP: Rs 116.33
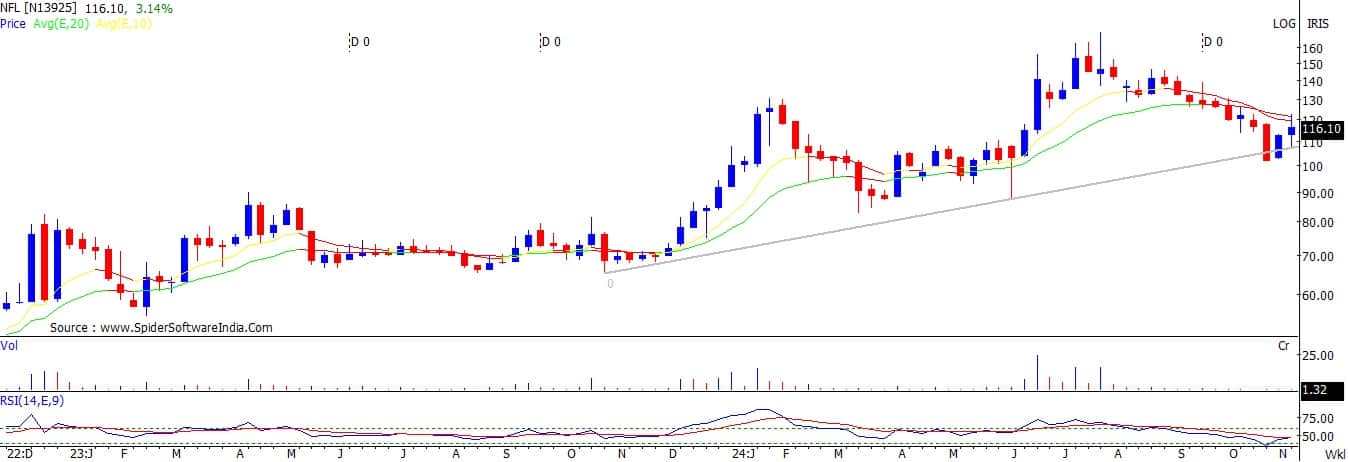
The downward correction of the last few months seems to have completed in National Fertilizers. The stock price has witnessed a decisive upside bounce from the support of an intermediate uptrend line since last week. Currently, the stock has been showing larger consolidation movements, and we expect this to be a buy-on-dips opportunity. Volume has started to expand during the upside breakout in the stock price, and the weekly 14-period RSI (Relative Strength Index) shows a positive indication.
Strategy: Buy
Target: Rs 128
Stop-Loss: Rs 110
NIIT | CMP: Rs 189.83
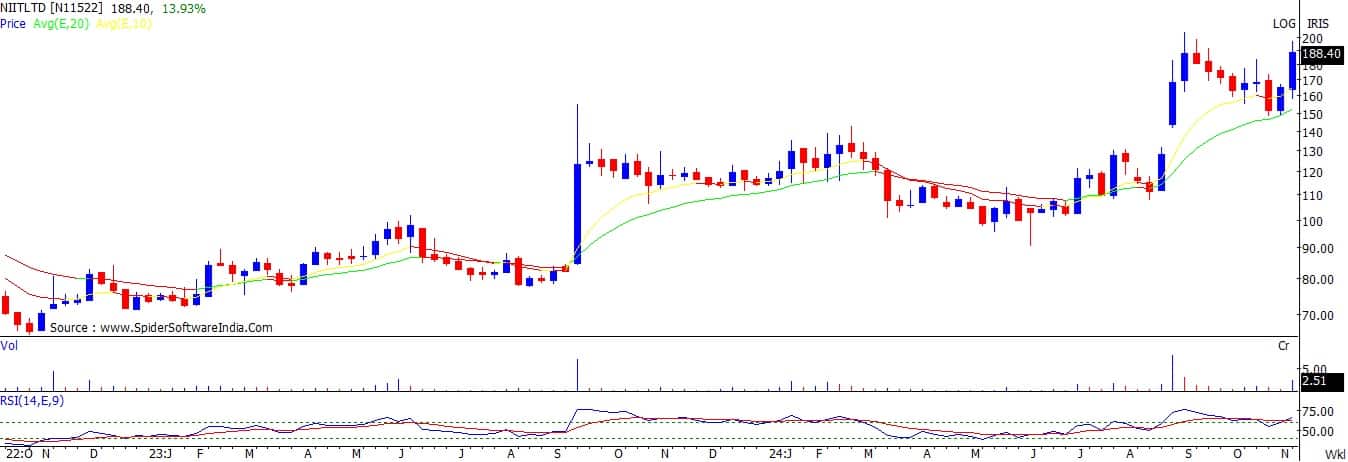
After witnessing a sharp upside breakout on November 6, NIIT has moved into a rangebound phase with a positive bias over the last couple of sessions. The bullish pattern, characterized by higher tops and bottoms, has been observed on the weekly chart. Volume on the weekly chart surged during the upside breakout in the stock price, and the weekly RSI has moved above the crucial 60-level mark, suggesting positive momentum.
Strategy: Buy
Target: Rs 210
Stop-Loss: Rs 178
Jubilant Foodworks | CMP: Rs 607.25

The downtrend of the last month seems to have completed for Jubilant Foodworks, and the stock price has formed a crucial bottom reversal pattern around the Rs 560 level. The stock has now moved above the cluster of hurdles formed by the descending trendline, as well as the daily 10/20 period EMAs, according to the daily time frame chart. Volume and RSI are showing positive indications, further strengthening the bullish outlook.
Strategy: Buy
Target: Rs 665
Stop-Loss: Rs 575
Rajesh Palviya, Senior Vice President Research (Head Technical Derivatives) at Axis Securities
Narayana Hrudayalaya | CMP: Rs 1,291

Narayana Hrudayalaya has continued to consolidate within the Rs 1,400-1,140 range since last year, indicating a medium-to-long-term sideways trend. Recently, the stock revisited its prior major support zone around the Rs 1,180 level and rebounded sharply. The stock is well-positioned above its 20, 50, 100, and 200-day SMAs, confirming bullish sentiments. Both the daily and weekly RSI indicators are in positive territory, signaling rising strength. Investors should buy, hold, and accumulate this stock, with an expected upside of Rs 1,370-1,430 and a downside support zone of Rs 1,250-1,200.
Strategy: Buy
Target: Rs 1,370, Rs 1,430
Stop-Loss: Rs 1,250
Federal Bank | CMP: Rs 206.77

Federal Bank is in a strong uptrend across all time frames, forming a series of higher tops and bottoms, reflecting bullish sentiment. Over the past three months, the stock has strongly sustained above its 38.2 percent Fibonacci support zone at Rs 184. This consolidation is well-supported by the 30-week SMA at Rs 183. The stock is also well-positioned above its 20, 50, 100, and 200-day SMAs, which are rising along with the price, further reaffirming the bullish trend.
The daily, weekly, and monthly RSI indicators are all in positive territory, suggesting rising strength across multiple time frames. On the daily chart, the stock has confirmed a "Rounding Bottom" formation around the Rs 205 level, indicating bullish sentiment. Investors should buy, hold, and accumulate this stock, with an expected upside of Rs 217-223 and a downside support zone of Rs 200-192.
Strategy: Buy
Target: Rs 217, Rs 223
Stop-Loss: Rs 200
Coromandel International | CMP: Rs 1,752

Coromandel International is in a strong uptrend across all time frames, forming a series of higher tops and bottoms, which signals bullish sentiment. In addition, with the current week's close, the stock has confirmed the breakout from the past three months' "down-sloping trendline," indicating a strong return of bulls. This breakout is accompanied by significant volumes, reflecting increased participation.
The daily, weekly, and monthly RSI indicators are all in positive territory, justifying the rising strength across multiple time frames. Investors should buy, hold, and accumulate this stock, with an expected upside of Rs 1,900-1,985 and a downside support zone of Rs 1,690-1,620.
Strategy: Buy
Target: Rs 1,900, Rs 1,985
Stop-Loss: Rs 1,690
Disclaimer: The views and investment tips expressed by investment experts on Moneycontrol.com are their own and not those of the website or its management. Moneycontrol.com advises users to check with certified experts before taking any investment decisions.
Discover the latest Business News, Sensex, and Nifty updates. Obtain Personal Finance insights, tax queries, and expert opinions on Moneycontrol or download the Moneycontrol App to stay updated!
Find the best of Al News in one place, specially curated for you every weekend.
Stay on top of the latest tech trends and biggest startup news.


