


The market recorded a fresh all-time closing high after a day of consolidation, with the Nifty 50 climbing above 24,300 for the first time intraday, while breadth turned strong. About 1,479 shares gained, while 868 shares declined on the NSE. The Nifty may march towards 24,500 if it holds 24,200, with support at 24,000. Here are some trading ideas for the near term:
Rupak De, Senior Technical Analyst at LKP Securities
BHEL | CMP: Rs 311.3

Bharat Heavy Electricals (BHEL) has given a falling trendline breakout, suggesting a rise in optimism. The trend looks positive as the index has sustained above the 50 EMA (Exponential Moving Average) on the daily timeframe. Additionally, a hidden positive divergence is visible on the daily RSI (Relative Strength Index), indicating strong momentum in the current bullish phase. On the higher end, the stock might move towards Rs 340. On the lower end, support is placed at Rs 297.
Strategy: Buy
Target: Rs 340
Stop-Loss: Rs 297
HUDCO | CMP: Rs 302

Housing & Urban Development Corporation (HUDCO) has given a consolidation breakout on the daily timeframe, with increasing volume. Additionally, the stock has been trading within a rising channel. The RSI indicates a bullish crossover, suggesting upward momentum.
Strategy: Buy
Target: Rs 315, Rs 325
Stop-Loss: Rs 288
PFC | LTP: Rs 531

Power Finance Corporation (PFC) has moved above previous consolidation, suggesting improved interest surrounding the stock. Additionally, the stock has sustained above a critical moving average. The RSI is in a bullish crossover and rising. Additionally, the stock price has been rising with a rising volume backup. Therefore, in the short term, the stock might move towards a higher level with the potential to reach up to Rs 560. On the lower end, support is placed at Rs 518.
Strategy: Buy
Target: Rs 560
Stop-Loss: Rs 518
Jatin Gedia, Technical Research Analyst, Capital Market Strategy at Sharekhan by BNP Paribas
Power Grid Corporation of India | CMP: Rs 335

Power Grid has been consolidating in the range of Rs 320 – 340 for the last two weeks. The hourly momentum indicator has triggered a fresh positive crossover, and the Bollinger Bands have begun to expand, indicating range expansion and suggesting that the positive momentum is likely to continue. We expect levels of Rs 345 – 349 in the short term. A stop-loss of Rs 322 should be maintained for the long positions.
Strategy: Buy
Target: Rs 345, Rs 349
Stop-Loss: Rs 322
DLF | CMP: Rs 841

DLF has corrected 9 percent in the last couple of weeks. The correction has halted at the 38.2 percent Fibonacci retracement level of the previous rise and started to form higher tops and higher bottoms on the daily charts, indicating a trend reversal. We expect a sharp recovery in the stock and expect levels of Rs 859 – 872 from a short-term perspective. A stop-loss of Rs 825 should be maintained for long positions.
Strategy: Buy
Target: Rs 859, Rs 872
Stop-Loss: Rs 825
Vidnyan S Sawant, Head of Research at GEPL Capital
KFin Technologies | CMP: Rs 761.75

Since March 2023, KFin Technologies has been on a consistent upward trajectory, forming higher highs and higher lows within a strong rising channel. Recently, the stock has shown signs of a turnaround from the lower trend line of this channel, indicating that it is maintaining its upward momentum and adhering to its established support levels.
Additionally, the stock is trading above its key 12-week and 26-week EMAs, which are critical indicators of the medium-term trend. The RSI is above 60, indicating that the stock is gaining momentum and is in a bullish phase. Additionally, the ratio chart of KFin Technologies against the Nifty shows a rising trend, indicating strengthening and readiness to outperform. Looking ahead, there is a potential upside for the stock, with a target of Rs 912. It's advisable to set a stop-loss at Rs 697 on a closing basis to manage risks effectively.
Strategy: Buy
Target: Rs 912
Stop-Loss: Rs 697
Century Textiles and Industries | CMP: Rs 2,351
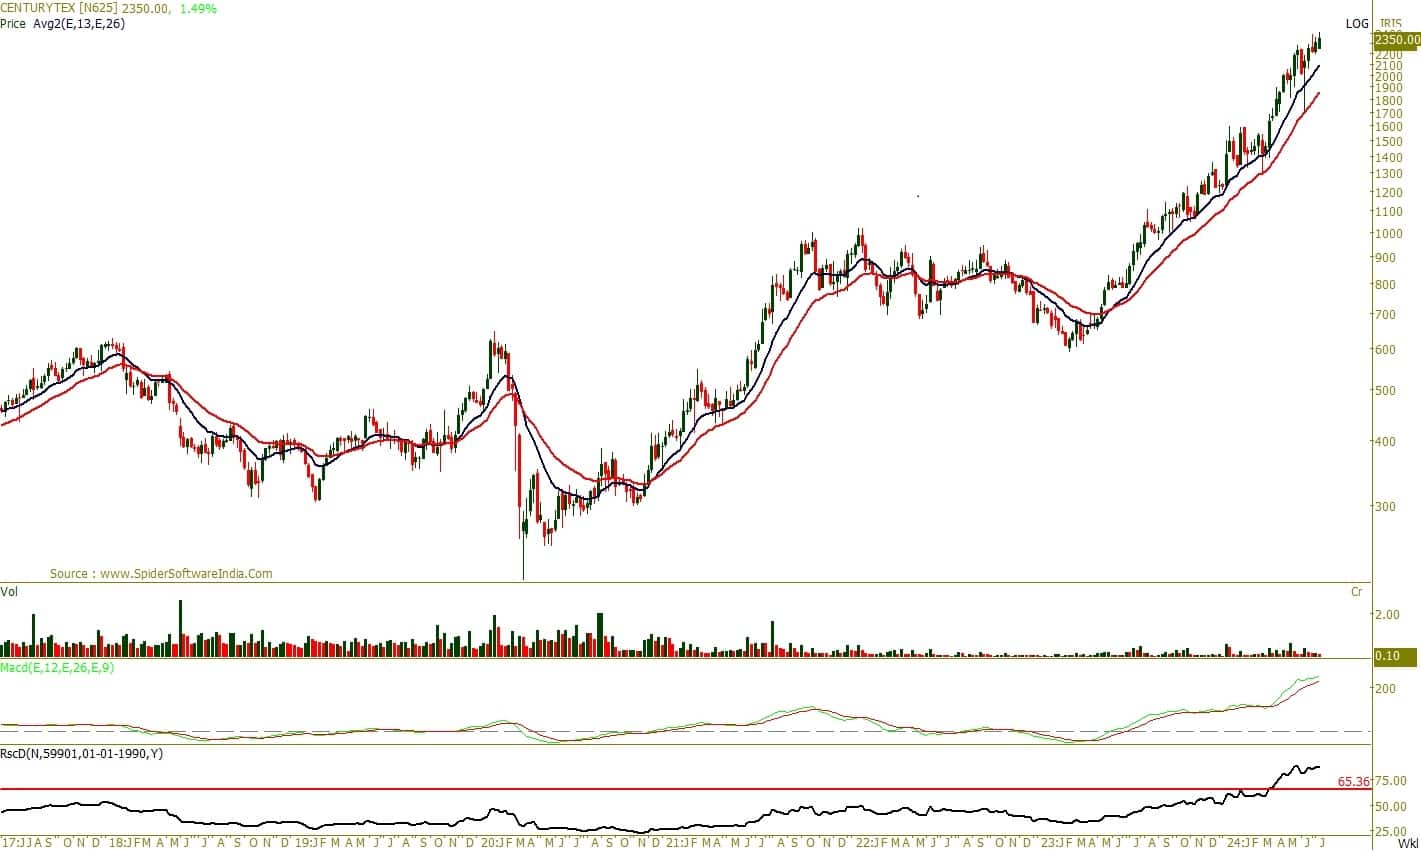
Century Textiles has delivered a standout performance, consistently forming higher tops and higher bottoms since 2023, indicating a bullish trend. Despite high market volatility from April to June 2024, the stock has demonstrated strong relative strength compared to the broader market. Trading above key averages like the 12-week and 26-week EMAs denotes a positive trend for the stock. The MACD (Moving Average Convergence Divergence) study waving high on positive territory indicates a trend backed by momentum.
Furthermore, the ratio chart of Century Textiles against the Nifty has been sustaining above multi-year highs from 2007, indicating sustained and continued outperformance. Looking ahead, there is potential upside for the stock with a target of Rs 2,937. To manage risks effectively, it's advisable to set a stop-loss at Rs 2,160 on a closing basis.
Strategy: Buy
Target: Rs 2,937
Stop-Loss: Rs 2,160
Mahindra and Mahindra | CMP: Rs 2,878

M&M has exhibited a robust price structure since February 2024, maintaining a rising trend and forming higher highs and higher lows on the monthly scale. The stock has shown strong relative strength compared to broader market volatility. Notably, during this rising trend, the stock has consistently demonstrated bullish mean reversion, with every minor dip being bought back from the 20-DEMA. A similar pattern is evident in the current price action, with the stock trading near its mean and likely to continue its upward trajectory.
Consistently trading above its 13-week and 26-week EMAs denotes a positive trend. Additionally, the ADX (Average Directional Index) study above 50 and +DI (Directional Indicator) above 40 reinforces the continuation of the upward move, highlighting bullish sentiment for the stock. The ratio chart of M&M against the Nifty shows signs of continued outperformance, with the ratio line rising higher after breaking out of the multi-year high.
Looking ahead, the stock appears poised for further gains, with a target set at Rs 3,456. To manage risks effectively, it's recommended to implement a stop-loss at Rs 2,649 on a closing basis.
Strategy: Buy
Target: Rs 3,456
Stop-Loss: Rs 2,649
RailTel Corporation of India | CMP: Rs 481

Since April 2023, RailTel Corporation has demonstrated robust momentum, showcasing a clear uptrend and trading just 6 percent below its all-time high levels and 6-month consolidation breakout level. On the daily scale, the stock has retested the congestion zone, suggesting that it is likely to continue its upward momentum. RailTel is currently trading above key moving averages, such as the 12-week and 26-week EMAs, indicating a positive trend. Additionally, the MACD study shows a bullish crossover, which denotes momentum in line with the trend.
Furthermore, the ratio chart of RailTel against the Nifty has been trending higher, indicating sustained outperformance. Looking ahead, there is a potential upside for the stock, with a target of Rs 560. It's advisable to set a stop-loss at Rs 440 on a closing basis to manage risks effectively.
Strategy: Buy
Target: Rs 560
Stop-Loss: Rs 440
Shitij Gandhi, Senior Technical Research Analyst at SMC Global Securities
Greaves Cotton | CMP: Rs 148

In June 2024, Greaves Cotton hit its lowest point in 52 weeks at Rs 112.05. Since then, it has shown a rapid recovery resembling a V-shape, with momentum surpassing its 200-day exponential moving average on the daily timeframe. Currently, the stock has formed an Inverted Head & Shoulders pattern, with a breakout observed above the pattern's neckline. Therefore, one can buy/hold/accumulate the stock for the expected upside of Rs 170-175 levels, with a downside support zone of Rs 142-140 levels.
Strategy: Buy
Target: Rs 170, Rs 175
Stop-Loss: Rs 130
Castrol India | CMP: Rs 243

For nearly three months, Castrol India has been consolidating in a broader range of Rs 180-230, with prices holding up well above its all-important moving averages on short-term as well as long-term charts. This week, we have observed a fresh breakout in the stock after a prolonged consolidation phase. The price action accompanied by rising volumes suggests a fresh upswing in the prices in upcoming sessions. Therefore, one can buy/hold/accumulate the stock for the expected upside of Rs 280-285 levels, with a downside support zone of Rs 230-225 levels.
Strategy: Buy
Target: Rs 280, Rs 285
Stop-Loss: Rs 200
ICICI Prudential Life Insurance Company | CMP: Rs 634.4
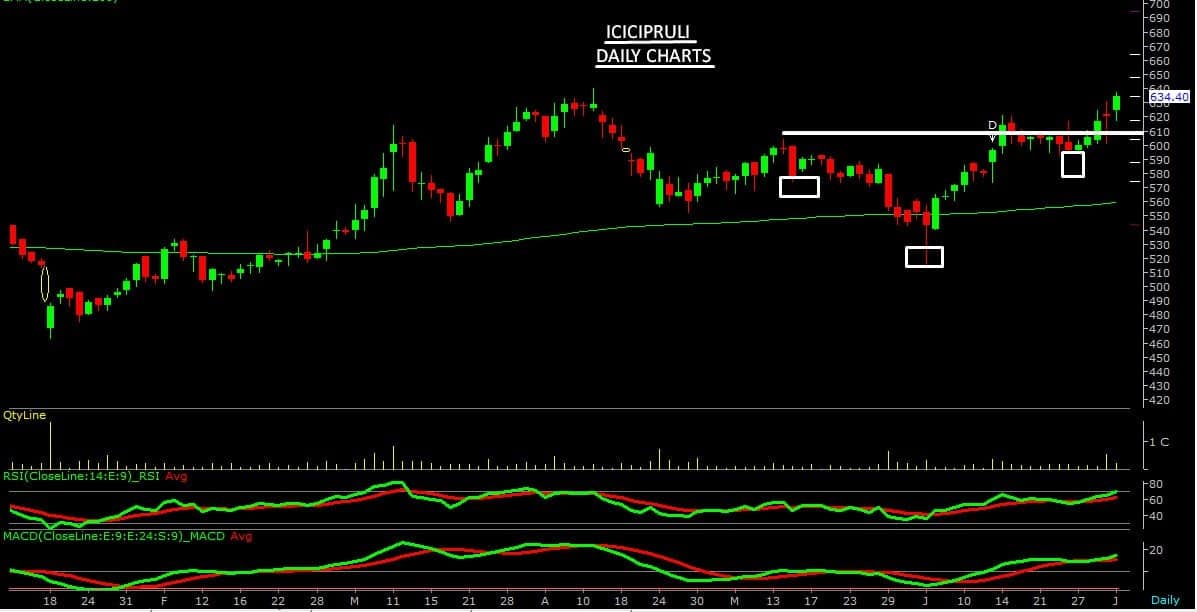
ICICI Prudential Life has exhibited a steady recovery, with prices gradually rising from the Rs 530 level to around the Rs 630 level over the past few weeks. Currently, the stock has gained fresh momentum, breaking through its key resistance zone and reaching towards its 52-week high of Rs 640.85. This bullish momentum is likely to continue, as a fresh breakout has been observed in the stock above the Inverted Head & Shoulders pattern. Therefore, one can buy/hold/accumulate the stock for the expected upside of Rs 685-690 levels, with a downside support zone of Rs 625-620 levels.
Strategy: Buy
Target: Rs 685, Rs 690
Stop-Loss: Rs 590
Disclaimer: The views and investment tips expressed by investment experts on Moneycontrol.com are their own and not those of the website or its management. Moneycontrol.com advises users to check with certified experts before taking any investment decisions.
Discover the latest Business News, Sensex, and Nifty updates. Obtain Personal Finance insights, tax queries, and expert opinions on Moneycontrol or download the Moneycontrol App to stay updated!
Find the best of Al News in one place, specially curated for you every weekend.
Stay on top of the latest tech trends and biggest startup news.


