


The market saw sharp selling pressure after a couple of days of consolidation, extending its fall for the fifth consecutive session on October 25, with weak breadth. About 2,138 shares fell compared to 376 that rose on the NSE. The trend is expected to remain in favour of bears, continuing the 'sell on rally' strategy. Below are some trading ideas for the near term:
Vinay Rajani, CMT, Senior Technical and Derivative Analyst at HDFC SecuritiesAngel One | CMP: Rs 2,799

After breaking out from the downward sloping trendline on the weekly charts, Angel One rose sharply with higher volumes. Due to the recent market correction, the stock has corrected toward the support of the 20-day SMA (Simple Moving Average). The primary trend of the stock remains bullish, with higher tops and higher bottoms on the weekly and monthly charts.
Strategy: Buy
Target: Rs 3,010, 3,100
Stop-Loss: Rs 2,650
CRISIL | CMP: Rs 5,080

CRISIL has formed a rounding bottom formation on the weekly charts. The recent price rise has been accompanied by an increase in volumes. The stock is trading above all important moving averages, indicating a bullish trend across all time frames. Indicators and oscillators have turned bullish on both the daily and weekly charts.
Strategy: Buy
Target: Rs 5,510, 5,700
Stop-Loss: Rs 4,750
Karur Vysya Bank | CMP: Rs 214.55

Karur Vysya Bank, after breaking out from the downward sloping trendline on the weekly charts, also rose sharply with higher volumes. Following the recent market correction, the stock has corrected toward the support of the 20-day SMA. The 8-day EMA is positioned above the 21-day EMA, indicating a bullish trend in the short-term time frame. The price breakout was accompanied by a rise in volumes.
Strategy: Buy
Target: Rs 235, 245
Stop-Loss: Rs 200
Jigar S Patel, Senior Manager - Equity Research at Anand RathiGrasim Industries | CMP: Rs 2,615

In the past two months, Grasim has consistently encountered resistance around the Rs 2,800 level, indicating difficulty in breaking past this mark. Additionally, the daily Relative Strength Index (RSI) has failed to surpass the 60 level, signaling weak upward momentum, which raises concerns for bullish investors. Recently, Grasim also broke below a bullish trendline, a bearish signal, and closed below its 20-day SMA high-low band. These technical indicators collectively suggest potential downside. Therefore, we recommend a short position in Grasim within the Rs 2,620-2,650 range, with a stop-loss above Rs 2,700 on a daily closing basis.
Strategy: Sell
Target: Rs 2,475
Stop-Loss: Above Rs 2,700
HDFC Life Insurance Company | CMP: Rs 709.5

Over the past two months, HDFC Life Insurance has repeatedly faced resistance near the Rs 745 level, which corresponds to a significant historical peak last seen in September 2021. This resistance level has proven challenging for the stock, indicating limited buying momentum above this mark. Further reinforcing this weak upward drive, the daily RSI has consistently failed to exceed the 60 level, a threshold that typically signals strength in bullish trends. This inability to reach higher RSI levels suggests a lack of strong buying interest, raising concerns for bullish investors.
Recently, the stock broke below an established bullish trendline, signaling a potential trend reversal to the downside. Adding to the bearish outlook, HDFC Life Insurance has closed below its 20-day SMA high-low band, indicating weakening support and momentum. Based on these technical factors, we recommend a short position in HDFC Life Insurance within the Rs 710-720 range. To manage risk, a stop-loss is advised above the Rs 748 level on a daily closing basis.
Strategy: Sell
Target: Rs 650
Stop-Loss: Above Rs 748
Britannia Industries | CMP: Rs 5,669.4

Britannia's stock has seen a substantial decline, dropping by around 13.5 percent in the past month. However, it appears to have found strong support at the Rs 5,600 level, a region that previously acted as a demand zone where buying interest emerged. Observing the hourly chart, a bullish divergence is visible on the RSI hourly scale—indicating a possible reversal—as recent red candles have decreased in size while green candles are becoming larger. This pattern suggests that selling momentum is weakening, and buyers may be gradually stepping in.
Given these signals, we recommend a long position in Britannia within the Rs 5,650-5,700 range, with an expected upside target of Rs 5,950. To manage downside risk, a stop-loss is suggested near Rs 5,535, set on a daily closing basis, ensuring an exit if the support fails and the stock declines further. This technical setup suggests a potential recovery, provided the demand zone holds strong.
Strategy: Buy
Target: Rs 5,950
Stop-Loss: Rs 5,535
Rajesh Bhosale, Technical Analyst at Angel OneThermax | CMP: Rs 5,431

Thermax has demonstrated impressive strength in a sluggish market, delivering a bullish range breakout on Friday, signaling a continued uptrend into next week. Prices remain well above key averages, with dips finding buying interest around the 50-day EMA (Exponential Moving Average). The momentum oscillator, RSI, has also provided a smoothed buy signal alongside its moving averages. Hence, we recommend buying Thermax around Rs 5,430 - Rs 5,410.
Strategy: Buy
Target: Rs 5,900
Stop-Loss: Rs 5,180
Vishnu Chemicals | CMP: Rs 491.5
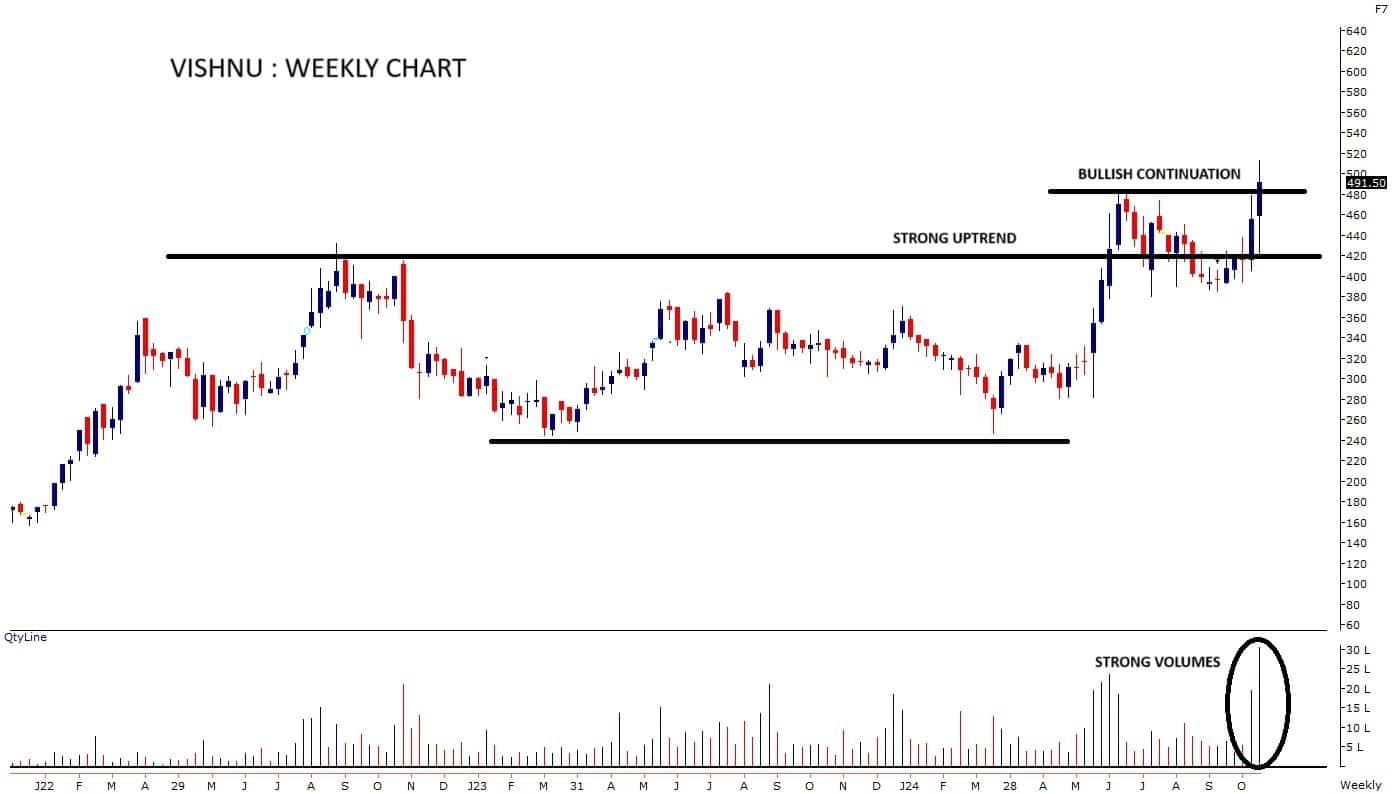
A robust uptrend is underway, with prices consistently forming a higher top-higher bottom structure. Currently trading in uncharted territory, Vishnu Chemicals shows high volumes supporting the upward movement, highlighting its strength despite a broader market sell-off. Multiple bullish patterns are emerging, suggesting continued outperformance in the near term. Hence, we recommend buying Vishnu Chemicals around Rs 491 - 487.
Strategy: Buy
Target: Rs 545
Stop-Loss: Rs 461
Disclaimer: The views and investment tips expressed by investment experts on Moneycontrol.com are their own and not those of the website or its management. Moneycontrol.com advises users to check with certified experts before taking any investment decisions.Discover the latest Business News, Sensex, and Nifty updates. Obtain Personal Finance insights, tax queries, and expert opinions on Moneycontrol or download the Moneycontrol App to stay updated!
Find the best of Al News in one place, specially curated for you every weekend.
Stay on top of the latest tech trends and biggest startup news.


