


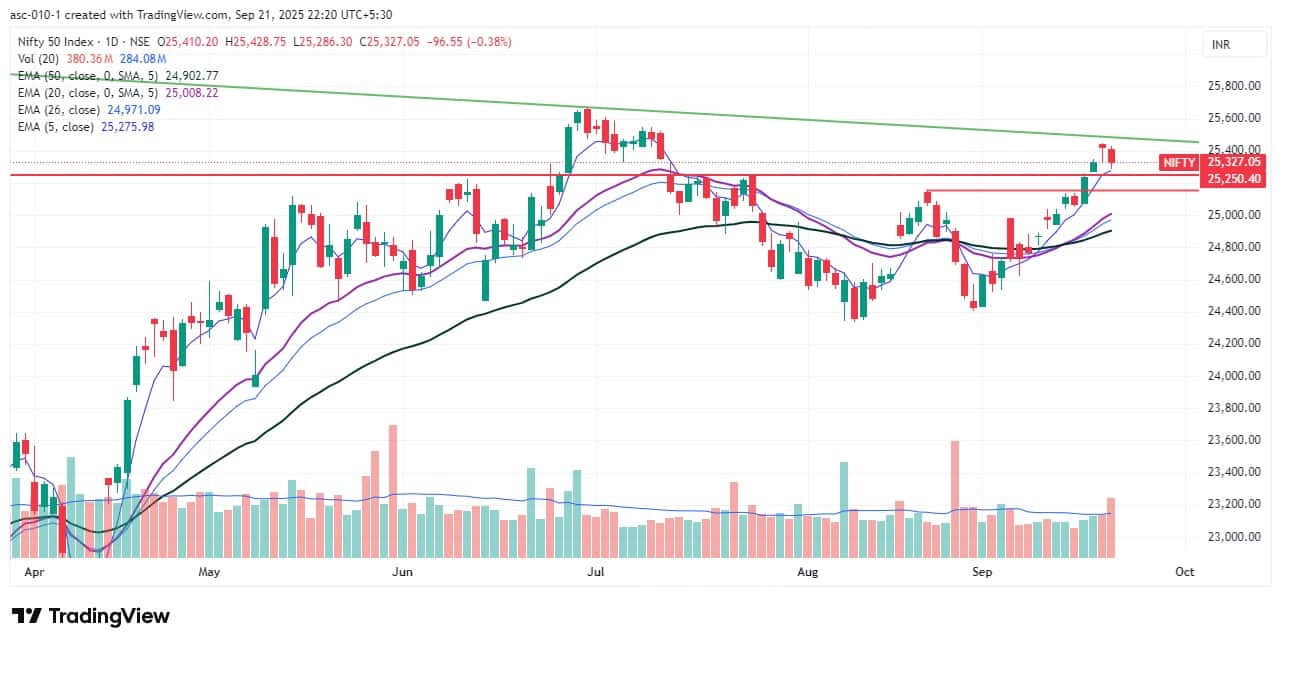
The Nifty 50 saw a minor pullback on September 19, after moving closer to a long-standing falling resistance trendline, which lies around the 25,450–25,500 range. This came after the index had posted gains for three consecutive sessions, with the day ending 0.4 percent lower. Analysts suggest that this consolidation may continue for a few sessions. However, the overall trend remains bullish, supported by positive technical and momentum indicators. If the index manages to hold the 25,250–25,150 support zone, an upward breakout post-consolidation could push the Nifty toward 25,500–25,700 levels. Conversely, a sharp fall below this zone could trigger bearish sentiment, bringing bears back into action, experts noted.
Here are 15 data points we have collated to help you spot profitable trades:
1) Key Levels For The Nifty 50 (25,327)
Resistance based on pivot points: 25,402, 25,435, and 25,490
Support based on pivot points: 25,293, 25,259, and 25,205
Special Formation: The Nifty 50 formed a bearish candle on the daily charts amid high volumes, but importantly, it sustained well above all key moving averages. Both short-term and medium-term moving averages are currently trending upward. The MACD showed a bullish crossover, with the histogram staying well above the zero line. The RSI stood at 63.71, maintaining a positive crossover, though it showed a slight downward inclination. All these indicators collectively suggest that bullish momentum remains intact, despite the short-term pullback.
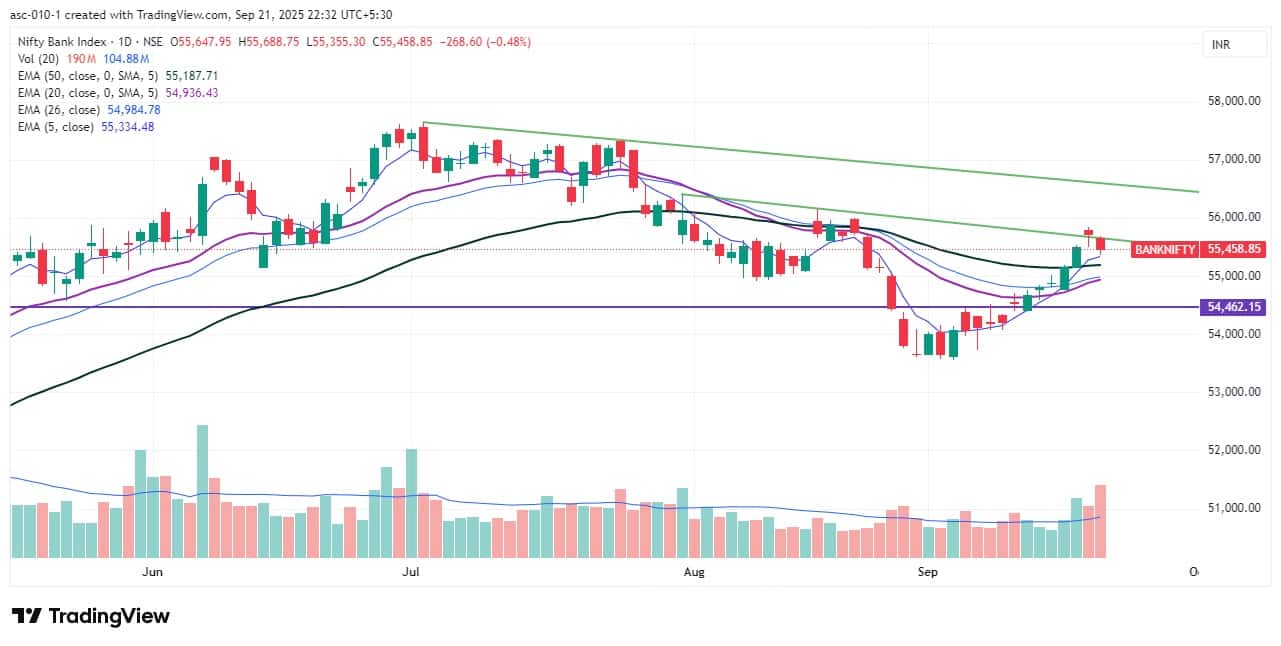
2) Key Levels For The Bank Nifty (55,459)
Resistance based on pivot points: 55,628, 55,707, and 55,834
Support based on pivot points: 55,374, 55,295, and 55,168
Resistance based on Fibonacci retracement: 56,075, 56,767
Support based on Fibonacci retracement: 54,392, 53,392
Special Formation:The Bank Nifty also experienced a half-percent pullback on the day, following 12 consecutive sessions of gains, and amid above-average volumes. However, it too remained above all key moving averages. The MACD moved above the zero line with a positive crossover, and the histogram remained above zero. The RSI declined slightly to 57.56, down from above 60, but still maintained a bullish crossover. Despite the pullback, the underlying structure remains strong, and technical indicators continue to favour bulls.
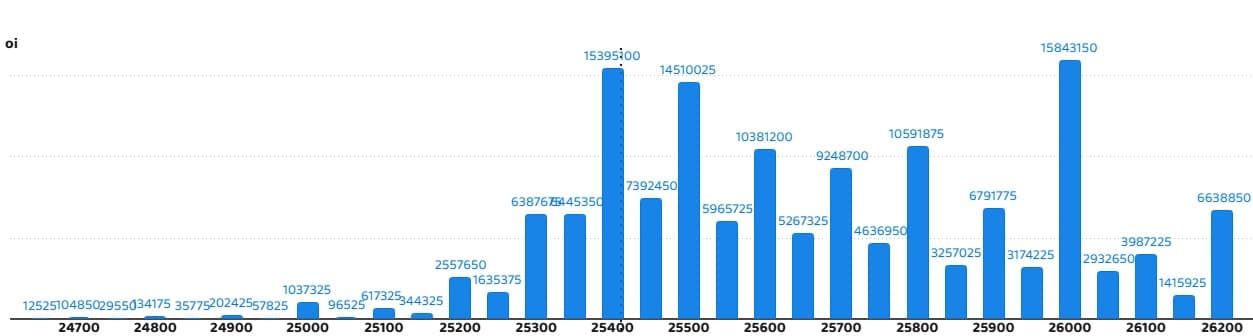
According to the weekly options data, the 26,000 strike holds the maximum Call open interest (with 1.58 crore contracts). This level can act as a key resistance for the Nifty in the short term. It was followed by the 25,400 strike (1.53 crore contracts), and the 25,500 strike (1.45 crore contracts).
Maximum Call writing was observed at the 25,400 strike, which saw an addition of 81.09 lakh contracts, followed by the 25,350 and 26,000 strikes, which added 44.93 lakh and 43.83 lakh contracts, respectively. The maximum Call unwinding was seen at the 26,100 strike, which shed 6.96 lakh contracts, followed by the 25,000 and 25,100 strikes, which shed 5.51 lakh and 1.17 lakh contracts, respectively.
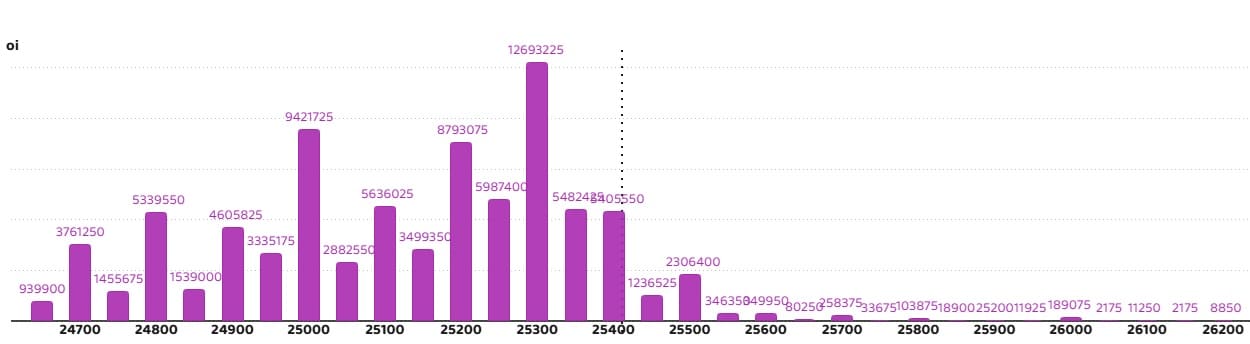
On the Put side, the maximum Put open interest was seen at the 25,300 strike (with 1.26 crore contracts), which can act as a key support level for the Nifty. It was followed by the 25,000 strike (94.21 lakh contracts) and the 25,200 strike (87.93 lakh contracts).
The maximum Put writing was placed at the 25,300 strike, which saw an addition of 36.9 lakh contracts, followed by the 25,250 and 25,350 strikes, which added 19.52 lakh and 12.48 lakh contracts, respectively. The maximum Put unwinding was seen at the 25,400 strike, which shed 36.1 lakh contracts, followed by the 25,450 and 24,700 strikes, which shed 27.92 lakh and 19.04 lakh contracts, respectively.
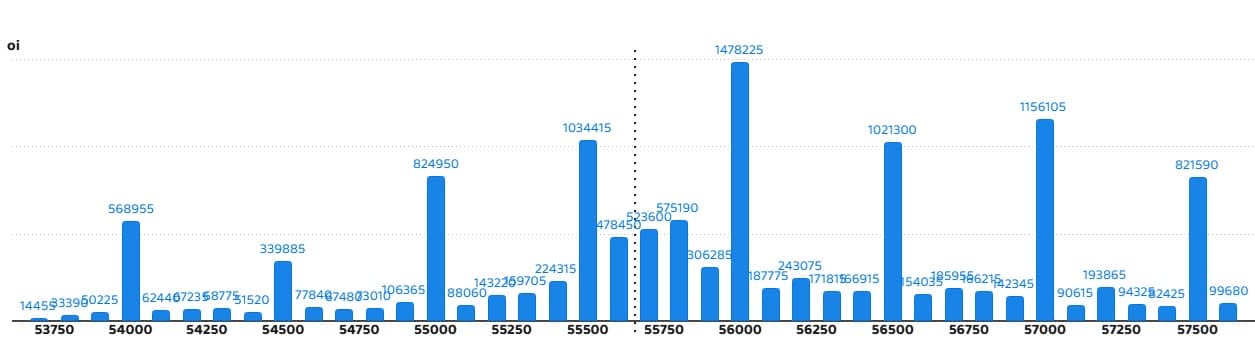
5) Bank Nifty Call Options Data
According to the monthly options data, the maximum Call open interest was placed at the 56,000 strike, with 14.78 lakh contracts. This can act as a key resistance level for the index in the short term. It was followed by the 57,000 strike (11.56 lakh contracts) and the 55,500 strike (10.3 lakh contracts).
Maximum Call writing was observed at the 55,500 strike (with the addition of 3.13 lakh contracts), followed by the 55,600 strike (2.26 lakh contracts), and the 56,000 strike (1.79 lakh contracts). The maximum Call unwinding was seen at the 54,900 strike, which shed 52,325 contracts, followed by 55,000 and 57,100 strikes, which shed 35,035 and 17,920 contracts, respectively.
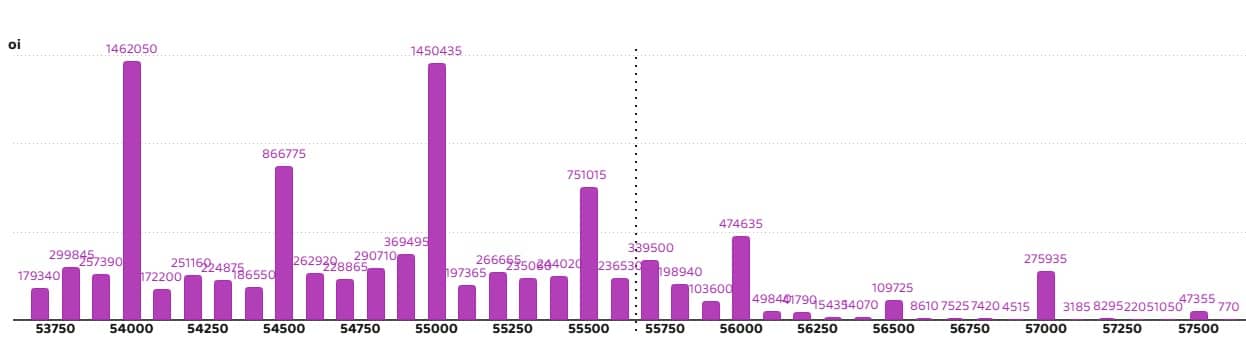
6) Bank Nifty Put Options Data
On the Put side, the 54,000 strike holds the maximum Put open interest (with 14.62 lakh contracts), which can act as a key support level for the index. This was followed by the 55,000 strike (14.5 lakh contracts) and the 54,500 strike (8.66 lakh contracts).
The maximum Put writing was observed at the 53,800 strike (which added 1.16 lakh contracts), followed by the 55,500 strike (62,575 contracts) and the 55,000 strike (30,450 contracts). The maximum Put winding was seen at the 54,500 strike, which shed 1.06 lakh contracts, followed by the 55,700 and 56,000 strikes, which shed 83,860 and 72,590 contracts, respectively.

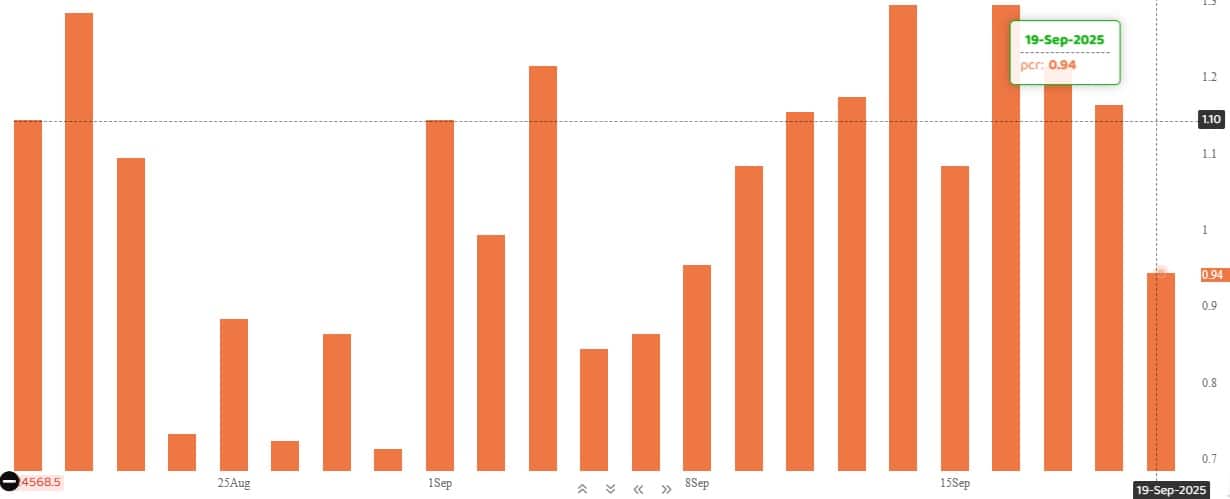
The Nifty Put-Call ratio (PCR), which indicates the mood of the market, fell to 0.94 on September 19, compared to 1.16 in the previous session.
The increasing PCR, or being higher than 0.7 or surpassing 1, means traders are selling more Put options than Call options, which generally indicates the firming up of a bullish sentiment in the market. If the ratio falls below 0.7 or moves towards 0.5, then it indicates selling in Calls is higher than selling in Puts, reflecting a bearish mood in the market.
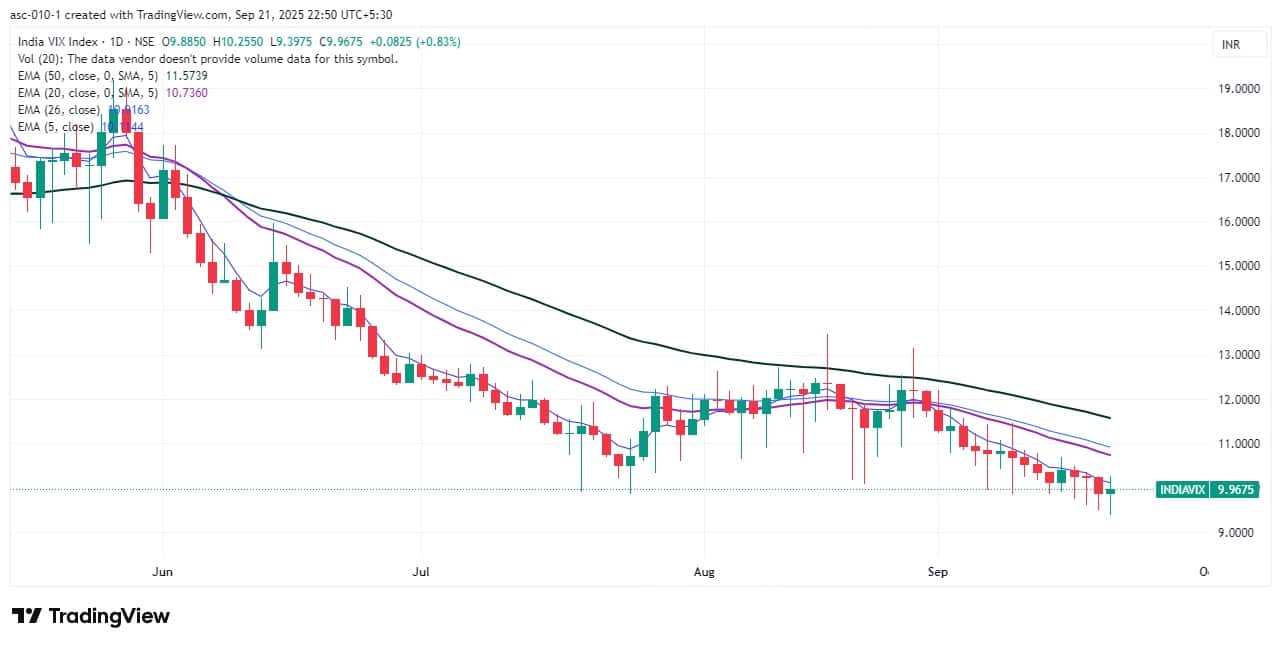
9) India VIX
The India VIX, commonly referred to as the fear index, rebounded by 0.83 percent to 9.97 on September 19, after declining for the previous three sessions. However, it continued to stay below the 10 mark, indicating low volatility and comfort for bulls in the short term.
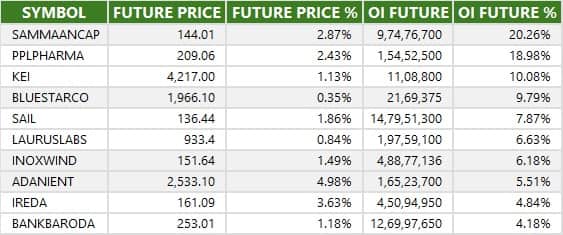
A long build-up was seen in 54 stocks. An increase in open interest (OI) and price indicates a build-up of long positions.
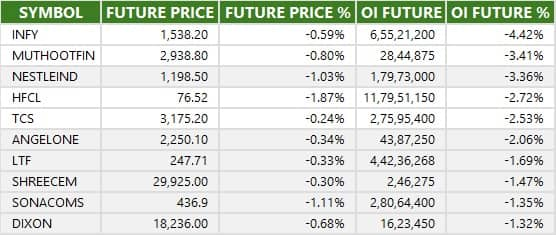
11) Long Unwinding (28 Stocks)
28 stocks saw a decline in open interest (OI) along with a fall in price, indicating long unwinding.
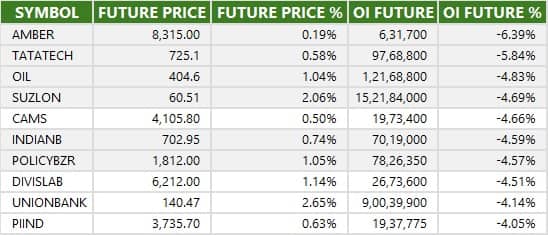
12) Short Build-up (84 Stocks)
84 stocks saw an increase in OI along with a fall in price, indicating a build-up of short positions.
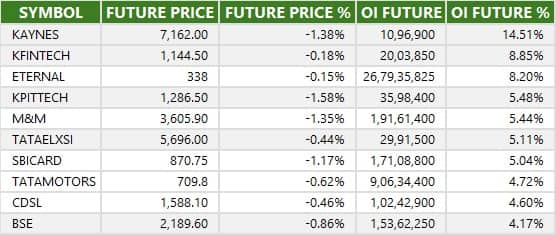
13) Short-Covering (46 Stocks)
46 stocks saw short-covering, meaning a decrease in OI, along with a price increase.
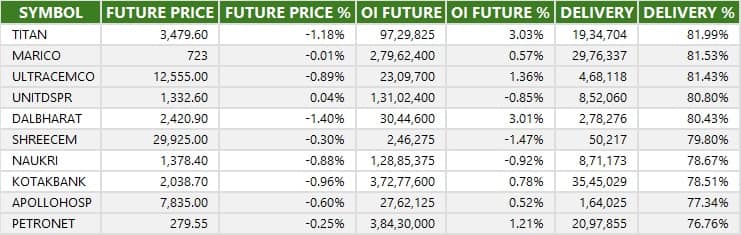
Here are the stocks that saw a high share of delivery trades. A high share of delivery reflects investing (as opposed to trading) interest in a stock.
Securities banned under the F&O segment include companies where derivative contracts cross 95 percent of the market-wide position limit.
Stocks added to F&O ban: Sammaan Capital
Stocks retained in F&O ban: Angel One, HFCL
Stocks removed from F&O ban: RBL Bank
Disclaimer: The views and investment tips expressed by experts on Moneycontrol are their own and not those of the website or its management. Moneycontrol advises users to check with certified experts before taking any investment decisions.Disclosure: Moneycontrol is a part of the Network18 group. Network18 is controlled by Independent Media Trust, of which Reliance Industries is the sole beneficiary.Discover the latest Business News, Sensex, and Nifty updates. Obtain Personal Finance insights, tax queries, and expert opinions on Moneycontrol or download the Moneycontrol App to stay updated!
Find the best of Al News in one place, specially curated for you every weekend.
Stay on top of the latest tech trends and biggest startup news.


