


Dalal Street stayed upbeat for yet another week, as the market entered the New Year on a bullish note, driving the benchmark indices up over 2.5 percent by the end of the weekly session on January 7. the possibility of faster monetary policy tightening and rate hikes by the US Fed though capped the upside. Banking and financials were the key drivers for the rally.
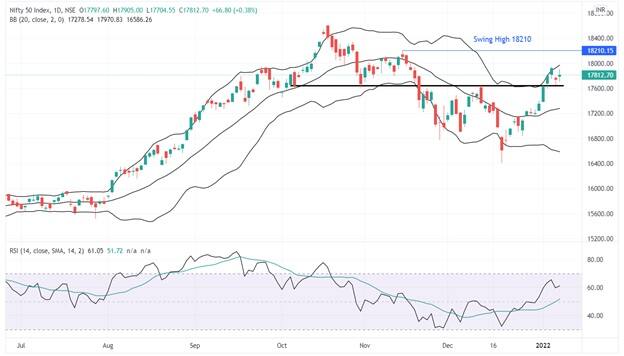
The Nifty50 climbed closer to the psychological 18,000 mark during the day and settled above 17,800 levels, up 459 points or 2.64 percent, on a week-on-week basis, forming a bullish candle on the weekly charts. Experts largely feel 18,000 will be crucial for a sharp uptrend in the coming days and as long as the index holds 20-week simple moving average of 17,553, then the positive momentum would continue, however, 17,640 is going to be a crucial support.
"Looking at the price action, the psychological level of 18,000 will act as a key resistance level. If the prices manage to breach this level, then we might see further up move towards 18,210 (Swing High). The key support level is placed at 17,640 (Multiple touch point level), we expect this to act as a key support level going forward," said Malay Thakkar, Technical Research Associate at GEPL Capital.
Looking at the options data, 18,000 CE and 17,500 PE have the maximum open interest. The 17,800 strike has identical Open Interest (30 lakh) on both Calls and Puts, which indicates that straddles are being written at 17,800 strike, according to him.
"We expect the index to be in the range of 17,500-18,000. Only a break above 18,000 will increase momentum on the upside and trigger fresh buying," Thakkar said.
Here are 10 trading ideas by experts for the next 3-4 weeks. Returns are based on January 7 closing prices:
Expert: Vinay Rajani, Senior Technical & Derivative Analyst at HDFC Securities
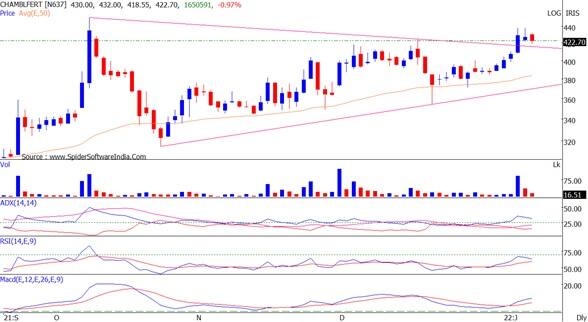
Chambal Fertilisers: Buy | LTP: Rs 423.15 | Stop-Loss: Rs 384 | Target: Rs 499 | Return: 18 percent
The stock has broken out from the symmetrical triangle pattern on the daily chart. Price breakout is accompanied with rising volumes. The stock has surpassed the previous swing high resistance of Rs 424.
Primary trend of the stock has been bullish with higher tops and higher bottoms. The stock is trading above all important moving averages. Indicators and oscillators have turned bullish on the daily charts.
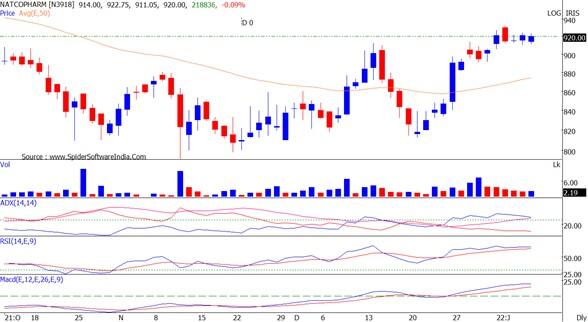
Natco Pharma: Buy | LTP: Rs 915.50 | Stop-Loss: Rs 824 | Target: Rs 1,065 | Return: 16.3 percent
The stock is on the verge of closing above the previous high resistance placed at Rs 901 on the daily chart. Recent Price rises have been with healthy volumes, which indicates accumulation in the stock.
The stock has surpassed the crucial resistance of its 50-day EMA. The stock is on the verge of surpassing the long term resistance of 200-day EMA, placed at Rs 900.
The stock has also broken out from last 10 weeks' price consolidation. Indicators and oscillators have turned bullish on the daily chart.
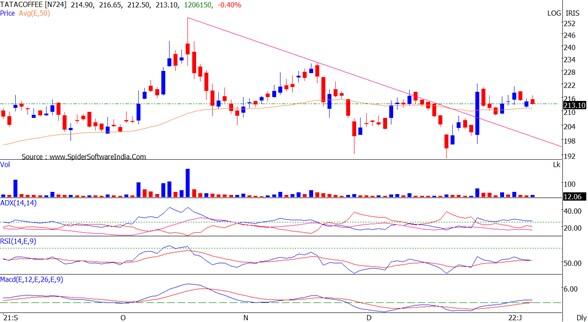
Tata Coffee: Buy | LTP: Rs 213.20 | Stop-Loss: Rs 195 | Target: Rs 257 | Return: 20.5 percent
Downward sloping trend line breakout was seen on the daily chart. The stock broke out from the resistance on December 27, which was followed by three days of running correction.
On December 31, the stock resumed the uptrend by forming a Rising Three candlestick pattern on the daily chart.
The price breakout is accompanied by a jump in volumes. Primary trend of the stock has been bullish with higher tops and higher bottoms. The stock is trading above all important moving averages. Indicators and oscillators have turned bullish on the daily charts.
Expert: Vijay Dhanotiya, Lead of Technical Research at CapitalVia Global Research
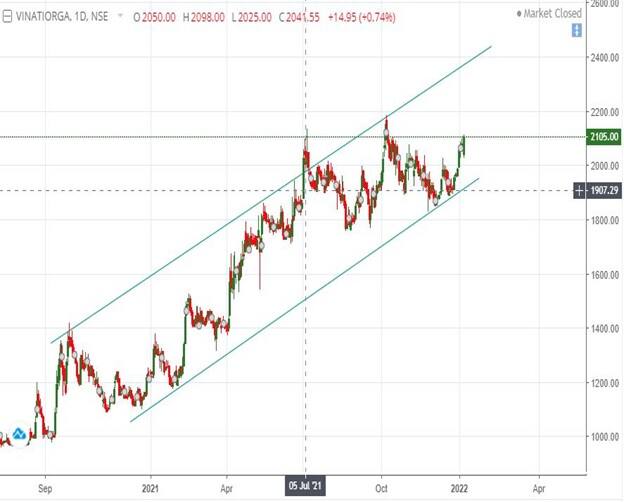
Vinati Organics: Buy | LTP: Rs 2,103.90 | Stop-Loss: Rs 1,800 | Target: Rs 2,550 | Return: 21.2 percent
The stock has been following an uptrend and is in the uptrend channel. We can see a bullish sentiment in the stock.
We have observed indicators like MACD (moving average convergence divergence) and RSI indicating the momentum in the stock is likely to continue.
We recommend a buy in Vinati Organics above Rs 2,110 with a target of Rs 2,550. Investors are advised to maintain a stop-loss at Rs 1,800.
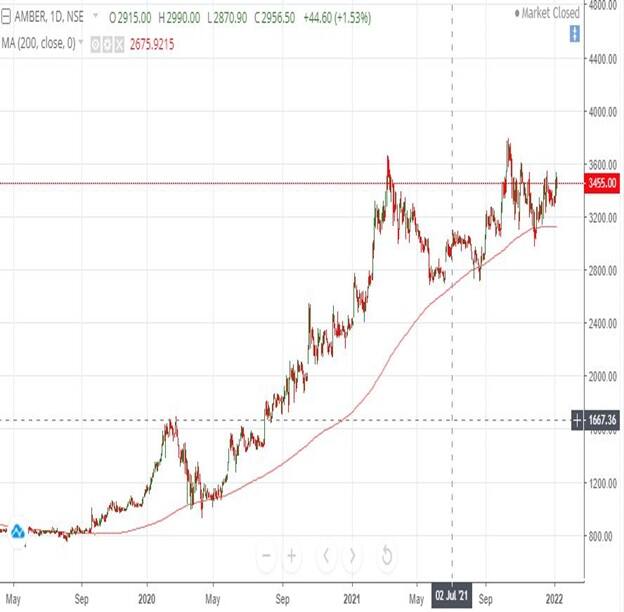
Amber Enterprises: Buy | LTP: Rs 3,428.50 | Stop-Loss: Rs 3,200 | Target: Rs 3,950 | Return: 15.2 percent
The stock has taken been trading in a positive manner and has reversed from the previous level of Rs 3,250.
It has also taken a support of 200 EMA and reversed from the same support level. We recommend a buy above Rs 3,550 with a target of Rs 3,950 with a stop-loss of Rs 3,200.
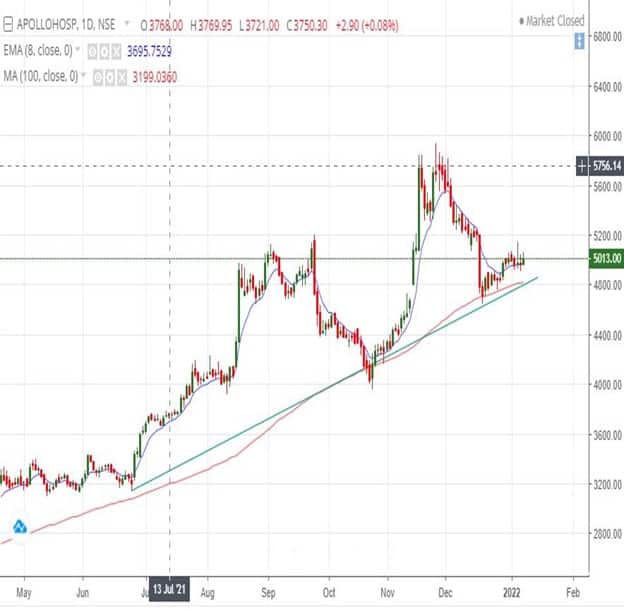
Apollo Hospitals Enterprises: Buy | LTP: Rs 5,021.85 | Stop-Loss: Rs 4,350 | Target: Rs 6,200 | Return: 23.5 percent
The stock has reversed from the support of lower band of an ascending channel. It has also taken the support of 100 EMA.
We have observed indicators like MACD and RSI indicating the momentum in the stock is likely to continue. We recommend a buy above Rs 5,150 with a target of Rs 6,200 with a stop-loss of Rs 4,350.
Expert: Ruchit Jain, Lead Research at 5paisa.com
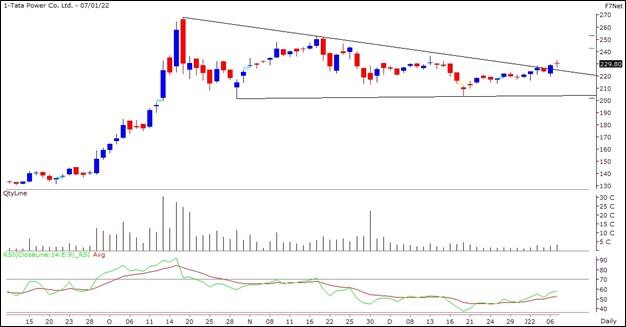
Tata Power: Buy | LTP: Rs 229.80 | Stop-Loss: Rs 219 | Target: Rs 243-245 | Return: 8.4 percent
Since the pandemic lows, this stock has seen a huge buying interest among market participants and had risen sharply without any meaningful correction till October 2021. However, in the later half of the month, prices took a pause and retraced some of the gains along with the broader market. But, rather than a price correction, the stock went through a time-wise correction as it has consolidated within a broad range in the last two-and-a-half months.
Now, prices have hinted at initial signs of a resumption of the momentum as it has given a breakout from a falling trend line resistance. Looking at the price action and the RSI (relative strength index) readings, we expect a positive momentum in the stock and hence, it could resume its broader uptrend.
Thus, short-term traders can look to trade with a positive bias and buy in the range of Rs 229-226 for a potential target of Rs 243-245. One can place a stop-loss below Rs 219 on long positions.
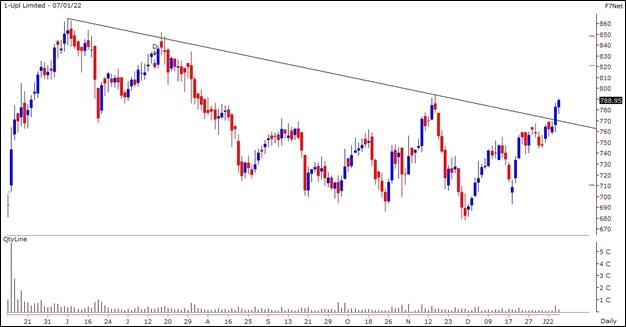
UPL: Buy | LTP: Rs 788.95 | Stop-Loss: Rs 759 | Target: Rs 820 | Return: 4 percent
The stock has been consolidating within a broad range since last seven months and has not seen any directional move. In this consolidation, whenever the prices have traded below the Rs 700 mark, the stock has witnessed good buying interest.
After this long consolidation, the stock finally witnessed a good momentum in last week in which it gave a breakout above its trend line resistance. Also, the volumes were good since the opening ticks itself on Friday indicating buying interest in the counter. Thus, we expect the stock to resume its broader uptrend and thus short term traders can look for buying opportunities.
Hence, traders can look to trade with a positive bias and buy in the range of Rs 784-778 for a potential target of Rs 820. One can place a stop-loss below Rs 759 on long positions.
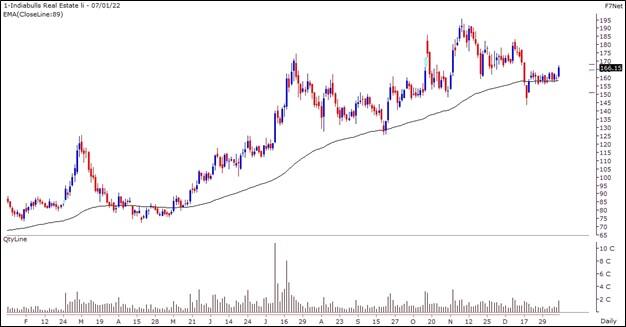
Indiabulls Real Estate: Buy | LTP: Rs 166.15 | Stop-Loss: Rs 157 | Target: Rs 183 | Return: 10 percent
In the last couple of months, the stock has witnessed a corrective phase from the highs of Rs 195. However, the stock seems to have completed its price-wise correction and entered into a timewise corrective phase in the later half of December. If we look at the historical data, it is observed that the 89-day EMA (exponential moving average) on the daily chart usually attracts a lot of buying interest in the stock and this time too, this average has acted as a support in the stock.
In Friday’s session, prices hinted at initial signs of buying interest as price up move during the day was seen with rise in volumes. Hence, we expect the stock to resume its uptrend and rally towards the precious highs going ahead.
Thus, traders can look to trade with a positive bias and buy around the current price of Rs 166 for a potential target of Rs 183 in next 3-4 weeks. One can place a stop-loss below Rs 157 on long positions.
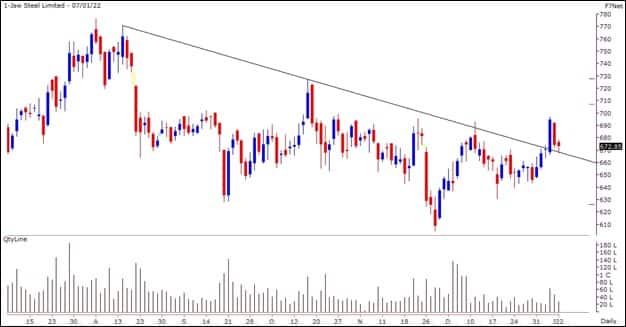
JSW Steel: Buy | LTP: Rs 672.85 | Stop-Loss: Rs 655 | Target: Rs 705 | Return: 5 percent
Although the Metal index started correcting in the mid-October 2021, this stock has been correcting since August and has seen a price-wise as well as a time-wise correction. On the longer term charts, this correction just seems to be a corrective phase within an uptrend and prices have given a breakout from a falling trend line resistance during this week.
With the Nifty Metal index chart also looking interesting, this stock seems to be poised for a resumption of its uptrend after this corrective phase.
Thus, traders can look to trade with a positive bias and buy around the current price of Rs 673 for a potential target of Rs 700-705 in the next 3-4 weeks. One can place a stop-loss below Rs 655 on long positions.
Expert: Chandan Taparia - Vice President - Equity Derivatives & Technical, Broking & Distribution at Motilal Oswal Financial Services
Aarti Industries: Buy | LTP: Rs 1,030.95 | Stop-Loss: Rs 1,005 | Target: Rs 1,080 | Return: 5 percent
The stock has given a consolidation breakout of last 52 trading sessions with decisive close above Rs 1,030 zone. It has taken support at its 50-day exponential moving average (EMA) and entire chemical sector is getting attraction. Mechanical indicator like RSI (relative strength index) is holding and giving a crossover signal.

Disclaimer: The views and investment tips expressed by investment experts on Moneycontrol.com are their own and not those of the website or its management. Moneycontrol.com advises users to check with certified experts before taking any investment decisions.
Discover the latest Business News, Sensex, and Nifty updates. Obtain Personal Finance insights, tax queries, and expert opinions on Moneycontrol or download the Moneycontrol App to stay updated!
Find the best of Al News in one place, specially curated for you every weekend.
Stay on top of the latest tech trends and biggest startup news.


