


The market snapped a four-week rally and closed six-tenth of a percent lower on the Nifty50 for the week ended June 23, led by correction in most sectors and a weakness in global peers.
The BSE Sensex surpassed its previous record high last week, but the Nifty50 fell short by 1 point from its record high. The index has taken support at 18,650 as well as 21-day EMA (exponential moving average 18,631), and closed at 18,665 on Friday.
It has formed a dark cloud cover candlestick pattern on the weekly scale at the swing high, bearish candlestick pattern on the daily charts, and double-top kind of pattern on the hourly timeframe.
The index is likely to consolidate in the monthly F&O expiry week, and if the index takes support and rebounds, then 18,700-18,900 could be the resistance area, whereas 18,500-18,450 could be the next crucial support in case of correction in coming sessions, experts said.
"My experience indicates that the first bearish signal in a strong bull market often turns out to be a bear trap. It is possible that there will be some correction or consolidation followed by a resumption of the trend," Prashant Shah, founder of Definedge, said.
For the bulls to regain control, Osho Krishan, Senior Analyst - Technical & Derivative Research at Angel One feels the upward movement should start from the current levels.
"If the levels of 18,600-18,650 are breached, then we might witness further price correction towards 18,500-18,450 levels. On the other hand, the bearish gap around 18,750 will now act as an immediate resistance, followed by the all-time high level at 18,888," he said.
Traders, accordingly, should note that the higher time frame charts continue to look intriguing and suggesting that any future price or time-wise correction should be seen as a buying opportunity for those who missed the upward trend in the past few months, he advised.
Let's take a look at the top 10 trading ideas by experts for the next three-four weeks. Returns are based on the May 19 closing prices:
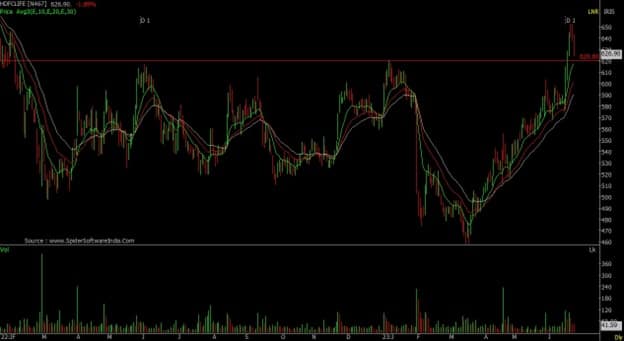
Expert: Shrikant Chouhan, Head of Research (Retail) at Kotak SecuritiesHDFC Life Insurance Company: Buy | LTP: Rs 626.90 | Stop-Loss: Rs 600 | Target: Rs 660-700 | Return: 12 percent
There is a strong boom in the stock. It has crossed the strong Rs 620 hurdle with increasing volumes. These types of patterns and breakouts help the stock to go up. After reaching Rs 660 level, it is again reacting to retest the break-out level, which will be an opportunity to buy the stock with a stop-loss at 600.
From higher levels, the stock may again move towards Rs 660 or Rs 700 levels. Buy between Rs 630 and Rs 620 for the given levels.
Narayana Hrudayalaya: Buy | LTP: Rs 977.7 | Stop-Loss: Rs 900 | Target: Rs 1,077-1,150 | Return: 18 percent
It was at Rs 725 in May 2023. It recorded an all-time high of Rs 1,077 in a span of one and a half months. It is doing better in the hospital stocks. In the last three days correction, the stock corrected back to Rs 977 and may correct further to Rs 950 or 940, which is a 38.20 percent retracement of the entire rally.
Since both the sector and the stock are performing, our strategy should be to buy the same at each major support. Keep a stop-loss at Rs 900 and buy between Rs 970 and Rs 940. On higher levels, it can again bounce towards Rs 1,077 or Rs 1,150 levels.

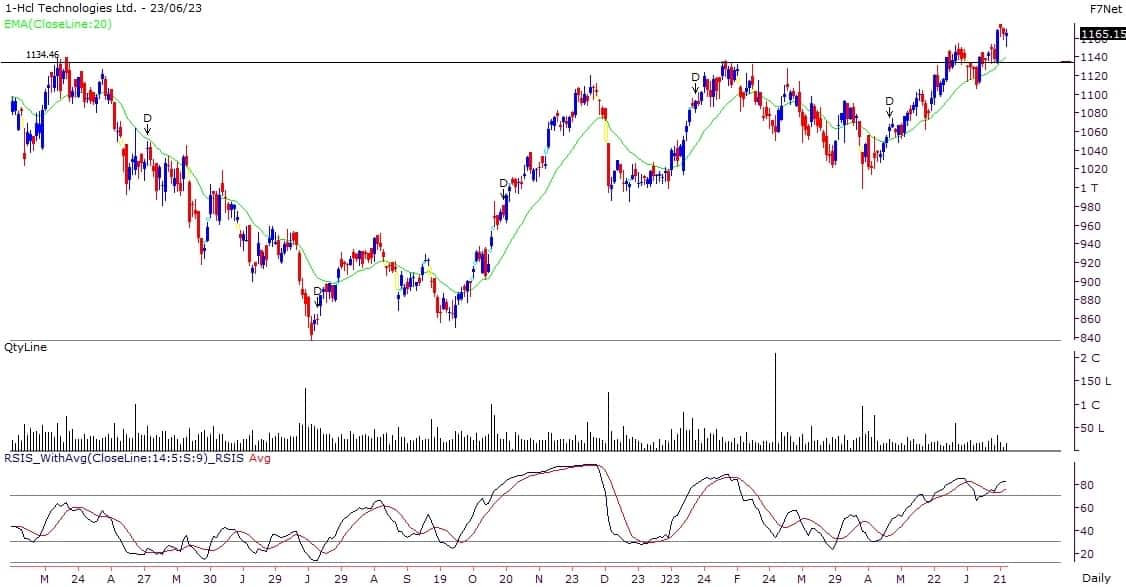
HCL Technologies: Buy | LTP: Rs 1,165 | Stop-Loss: Rs 1,110 | Targets: Rs 1,220-1,250 | Return: 7 percent
The IT stocks have been witnessing a gradual recovery, and within the IT heavyweights, HCL Technologies has given a breakout above its important resistance of Rs 1,140. The RSI (relative strength index) readings on both daily as well as the weekly charts are hinting at a positive momentum and the 20 DEMA is also acting as a support on declines.
Hence, positional traders can look to buy HCL Tech around current market price of Rs 1,165 and add on any dips towards the support of Rs 1,140. The stop-loss for long positions should be placed below Rs 1,110 while the targets could be expected around Rs 1,220 and Rs 1,250.
Natco Pharma: Buy | LTP: Rs 674 | Stop-Loss: Rs 630 | Target: Rs 720 | Return: 7 percent
Post an up-move in the initial couple of weeks of May 2023, prices had seen consolidation in a range above its 20 DEMA support. This led to formation of a ‘Bullish Flag’ pattern on the daily chart and prices have given a breakout from the pattern.
The volumes on breakout were high while the RSI oscillator is hinting at a resumption of the positive momentum.
Hence, traders can buy this stock on dips in the range of Rs 665-655 for potential near term target of Rs 720. The stop-loss on long positions should be placed below Rs 630.

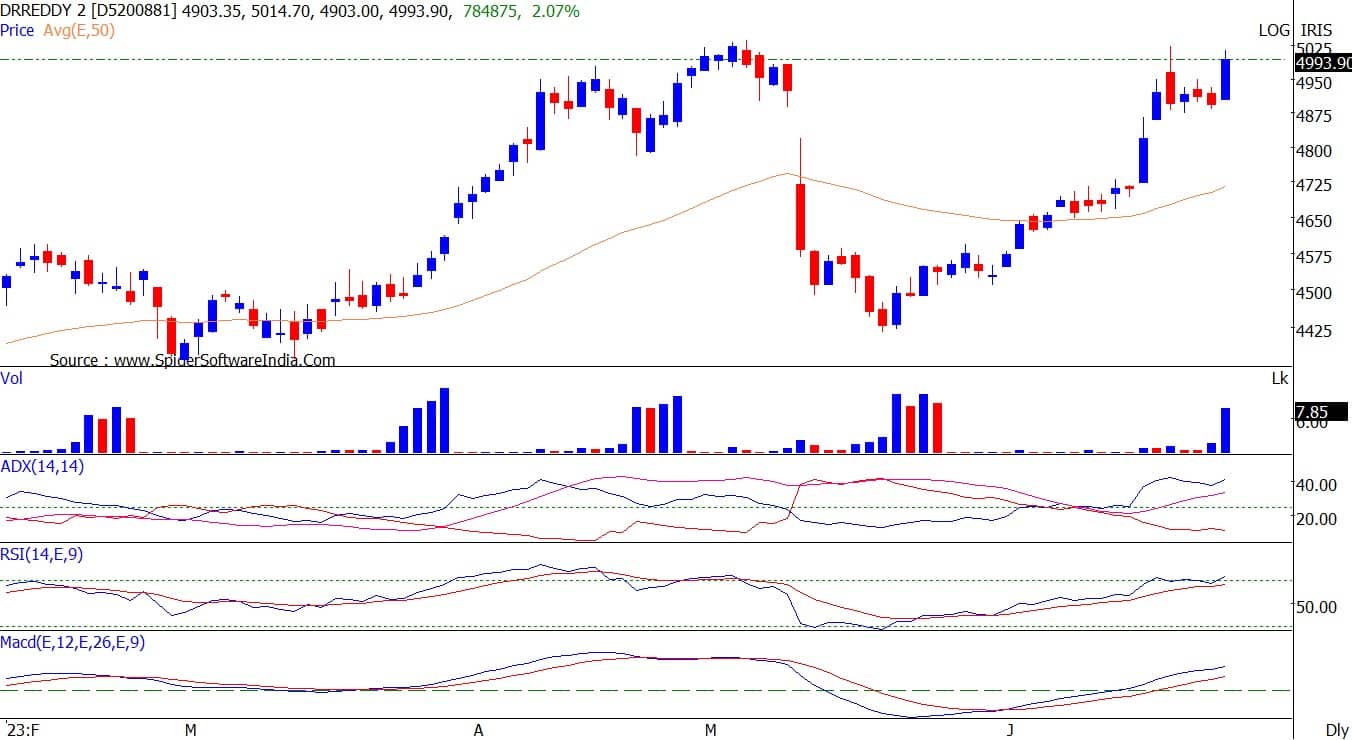
Dr Reddy's Laboratories July Futures: Buy | LTP: Rs 4,999 | Stop-Loss: Rs 4,882 | Target: Rs 5,150 | Return: 3 percent
The stock has witnessed a long build-up on June 23, 2023, where price rose by 2 percent and open interest went up by 6 percent. Nifty Pharma Index has also seen long build up of 2.5 percent.
The stock price has formed rounding bottom formation and managed to surpass the previous swing high resistance of Rs 4,989. Pharma sector is expected to outperform for the coming weeks.
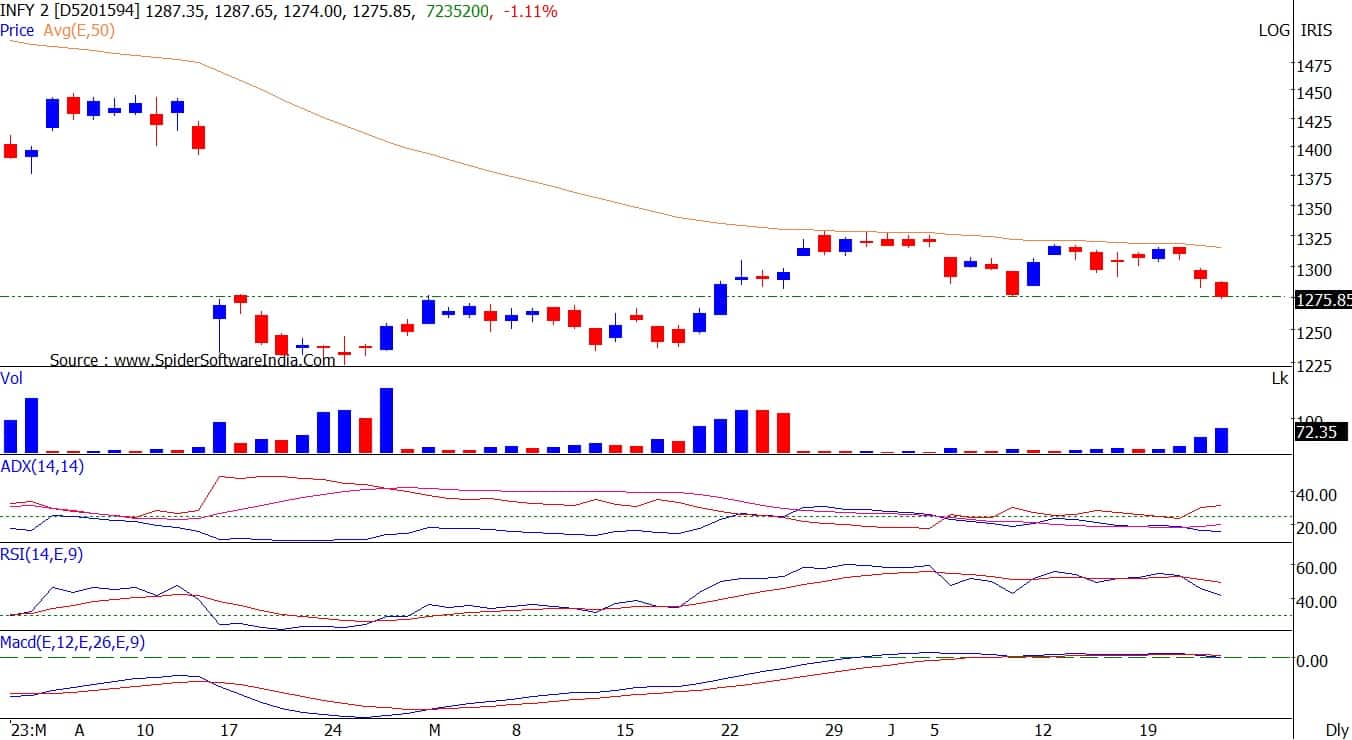
Infosys July Futures: Sell | LTP: Rs 1,276 | Stop-Loss: Rs 1,315 | Target: Rs 1,220 | Return: 4.4 percent
The stock witnessed a short build-up on June 23, 2023, where price fell by 1 percent and open interest went up by 2 percent. The stock price has broken down from upward sloping trendline support and closed below that.
It has also confirmed lower top and lower bottom formation on the daily charts. IT index is underperforming and the same is expected to continue in coming days.
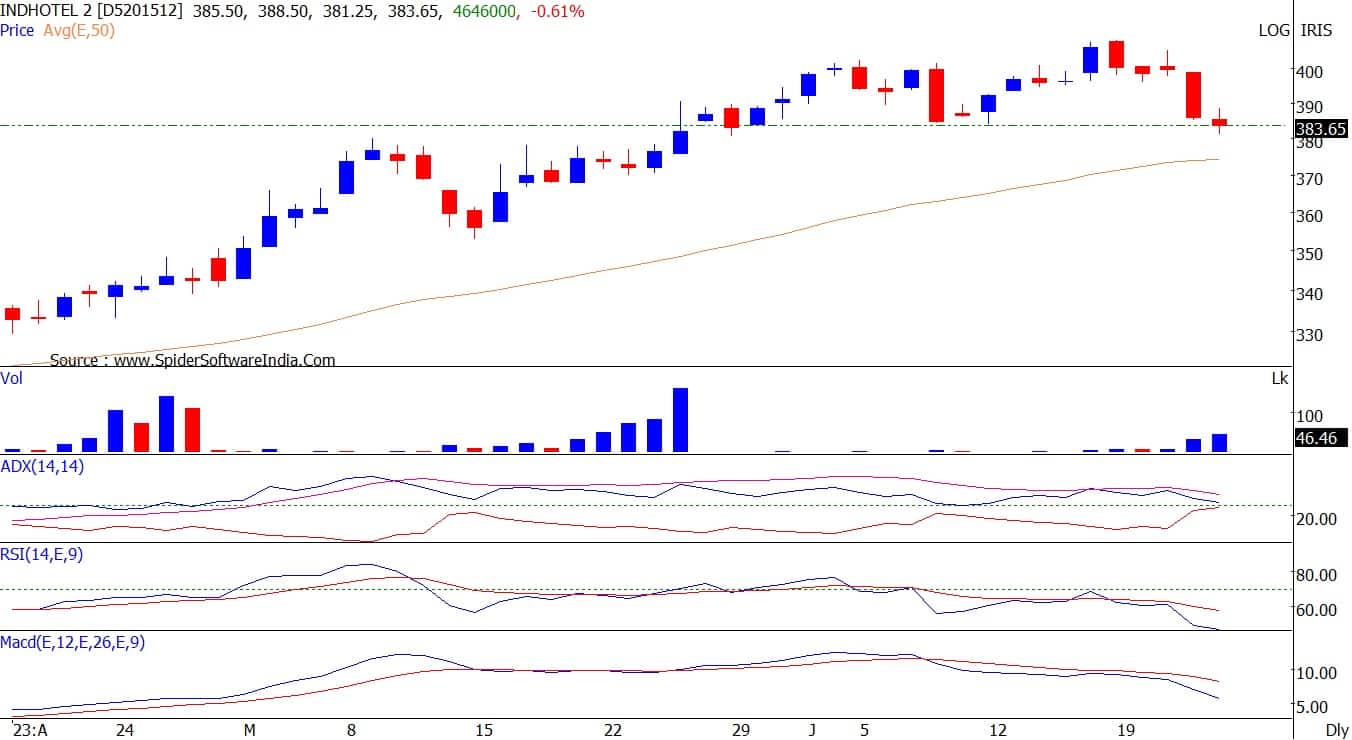
Indian Hotel Company July Futures: Sell | LTP: Rs 383.70 | Stop-Loss: Rs 397 | Target: Rs 363 | Return: 5.4 percent
The stock saw a short build-up on June 23, where price fell by 0.6 percent and open interest went up by 6 percent. RSI (relative strength index) has formed negative divergence on the daily chart, which indicates probable bearish trend reversal.
The stock price has closed below its 20-day EMA support. MACD (moving average convergence divergence) and DMI (directional movement index) indicators have also turned bearish on the daily charts.
C E Info Systems (MapmyIndia): Buy | LTP: Rs 1,237 | Stop-Loss: Rs 1,170 | Target: Rs 1,345 | Return: 9 percent
The stock has seen a break out of a falling wedge pattern on the weekly timeframe with a bullish candlestick as it closed above the highs of last 14-week which indicates bullish strength.
On the indicator front, the supertrend indicator is indicating a bullish reversal trend which can be used as a confluence towards the bullish view. The Ichimoku Cloud is also suggesting a bullish move as the price is trading above the conversion line, base line and cloud. Momentum oscillator RSI (14) is at around 69 on the daily time frame indicating strength by sustaining above 50.
Observation of the above factors indicates that a bullish move in MapmyIndia is possible for target upto Rs 1,345. One can initiate a buy trade in between the range of Rs 1,234-1,237, with a stop-loss of Rs 1,170 on daily closing basis.

D-Link India: Buy | LTP: Rs 249.50 | Stop-Loss: Rs 233 | Target: Rs 270 | Return: 8 percent
D-Link India has seen taking support from an upward sloping support trendline and closing with a bullish candlestick on the weekly timeframe with above average volumes. It is also trading above important EMAs of 20/50/100/200 which indicates strength.
On the indicator front the momentum oscillator RSI (14) is at around 59 on the daily time frame indicating strength by sustaining above 50. The Ichimoku Cloud is also suggesting a bullish move as the price is trading above the conversion line, and base line on the daily timeframe.
Observation of the above factors indicates that a bullish move in D-Link India is possible for target upto Rs 270. One can initiate a buy trade in the range of Rs 245-249, with a stop-loss of Rs 233 on daily closing basis.

Force Motors: Buy | LTP: Rs 2,322.50 | Stop-Loss: Rs 2,100 | Target: Rs 2,600 | Return: 12 percent
Force Motors has seen breaking out of an upward sloping parallel channel pattern on the weekly timeframe with above average volumes and is trading above all its important EMAs on the daily timeframe which indicates bullish strength.
The supertrend indicator is also indicating a bullish continuation which supports the bullish view. Momentum oscillator RSI (14) is at around 77 on the daily time frame indicating strength by sustaining above 50 and the Ichimoku Cloud is also suggesting a bullish move as the price is trading above the conversion line, base line and cloud.
Observation of the above factors indicates that a bullish move in Force Motors is possible for target upto Rs 2,600. One can initiate a buy trade in between the range of Rs 2,310-2,322, with a stop-loss of Rs 2,100 on daily closing basis.

Discover the latest Business News, Sensex, and Nifty updates. Obtain Personal Finance insights, tax queries, and expert opinions on Moneycontrol or download the Moneycontrol App to stay updated!
Find the best of Al News in one place, specially curated for you every weekend.
Stay on top of the latest tech trends and biggest startup news.


