
Gaurav Bissa
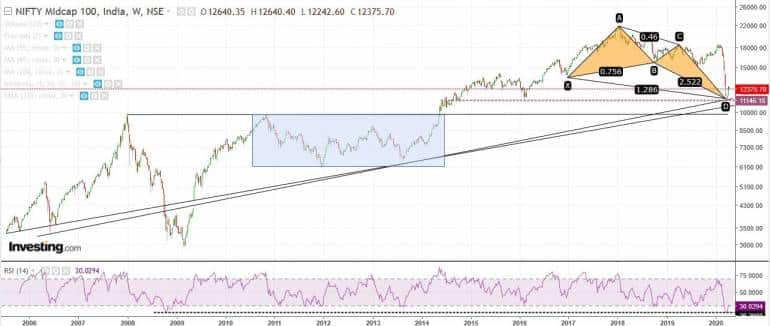
The Nifty Midcap100 index witnessed a double bottom breakout on the weekly charts around 9,800 levels in 2014 and since then it has witnessed a strong up move till 2018 during which it started to show some signs of exhaustion.
This was also reflected from the bearish divergence seen between the years 2017 and 2018 where the index witnessed a sharp jump, but RSI i.e. Relative Strength Index, failed to make new highs.
Since then it has been underperforming the Nifty50 index by forming a lower high lower low. The index has witnessed a correction of 50 percent from the top and is now trading near the crucial support areas.
The index has jumped from 11,000 levels which have been lending strong support on the last three occasions as shown by a horizontal line.
The index has formed a bullish harmonic butterfly pattern on the weekly charts which is a bullish reversal in nature. The potential reversal zone which can also be called a trigger point has formed at the previously mentioned support zone of around 11200.
On the long-term weekly log charts, rising trendline supports also coincide with the critical 11000 levels. The RSI has also reversed from 19-20 levels which it last touched during 2008 which supports the postulate of potential upside in the coming weeks.
Thus, based on the technical parameters above one can infer that the Nifty Midcap100 index can test 15000-16000 zone as long as it trades above 10800 levels.
(The author is AVP-Technicals And Derivatives at LKP Securities)
Disclaimer: The views and investment tips expressed by investment experts on Moneycontrol.com are their own and not that of the website or its management. Moneycontrol.com advises users to check with certified experts before taking any investment decisions.

Discover the latest Business News, Sensex, and Nifty updates. Obtain Personal Finance insights, tax queries, and expert opinions on Moneycontrol or download the Moneycontrol App to stay updated!