


The storm is back — and it’s not for the faint-hearted.
Volatility surged to its highest level since the peak of the COVID-19 crisis, with global markets caught off guard after US President Donald Trump reignited trade tensions by initiating a new round of tariffs. China's strategic retreat from immediate retaliation only added more fuel to the uncertainty. The result? A rollercoaster week in equity markets characterised by aggressive gap-ups and gap-downs that tested both nerves and strategies.
But while panic might have defined the sentiment for many, seasoned traders with a structured, rule-based approach thrived in the chaos. For these disciplined participants, volatility isn’t the enemy — it’s an opportunity.
Among several analytical tools, harmonic trading patterns have emerged as a powerful framework for navigating these erratic markets. One sector, in particular, is flashing a potential reversal signal: the Nifty Auto Index.
Nifty Auto Index Weekly Chart
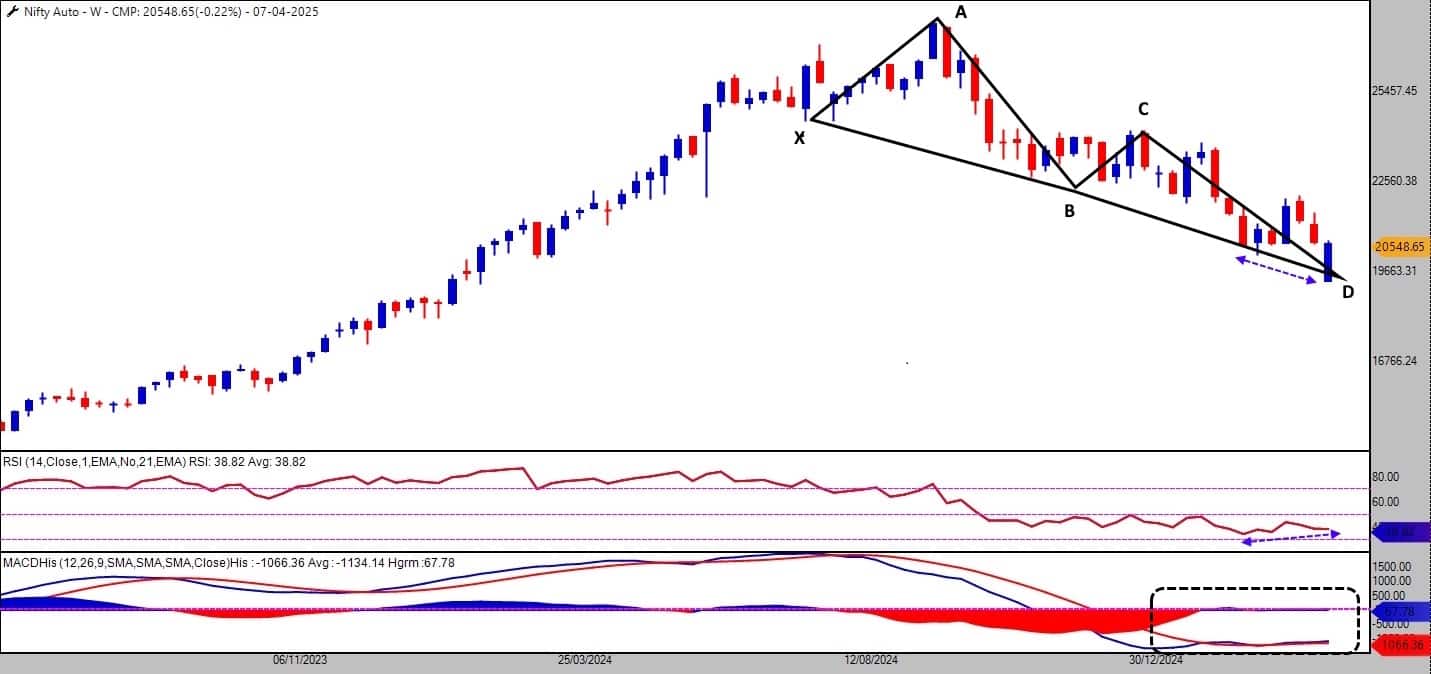
Technical analysts are closely watching the Bullish Black Swan harmonic pattern visible on the weekly chart of the Nifty Auto Index. The index peaked in September 2024, only to fall over 30 percent from its high—a move that many would label a definitive bearish trend.
But where others see a continued fall, harmonic traders see reversal potential.
This specific Black Swan pattern aligns with multiple Fibonacci retracement levels, reinforcing its credibility. By nature, harmonic patterns signal trend exhaustion and reversal, encouraging traders to buy at critical bottoms formed at the convergence of these key ratios.
The presence of a Bullish Belt Hold candlestick formation, typically associated with sharp buyer interest after an extended downtrend, adds further weight.
RSI (Relative Strength Index) is showing a positive divergence, suggesting that despite price falling to new lows, momentum is improving—a classic trap for complacent bears.
MACD (Moving Average Convergence Divergence) has printed a bullish crossover, and the histogram is consolidating near the zero line, signaling a shift in momentum.
With the index approaching technically significant support levels, select stocks are offering attractive risk-to-reward setups that traders should monitor.
Stock Watch: Technical Reversal in Focus
MRF, India's most premium tyre manufacturer and one of the costliest stocks in the Indian markets, is turning heads again—not for its price tag, but for what the weekly chart is signalling.

The stock has bounced off its long-term 200-Week Exponential Moving Average (200WEMA) Channel, a reliable zone of historical support defined using both the highs and lows of the 200WEMA. This zone has acted as a cushion during multiple market downturns.
Interestingly, MRF has also formed a Rising Three candlestick pattern, typically a continuation pattern. In this context—emerging off key support—it suggests a reversal backed by bullish strength.
Traders watching the confluence of candlestick signals and moving average dynamics may find this a potential opportunity.
Exide, one of India's oldest and most trusted battery manufacturers, is showing signs of life on the technical front.
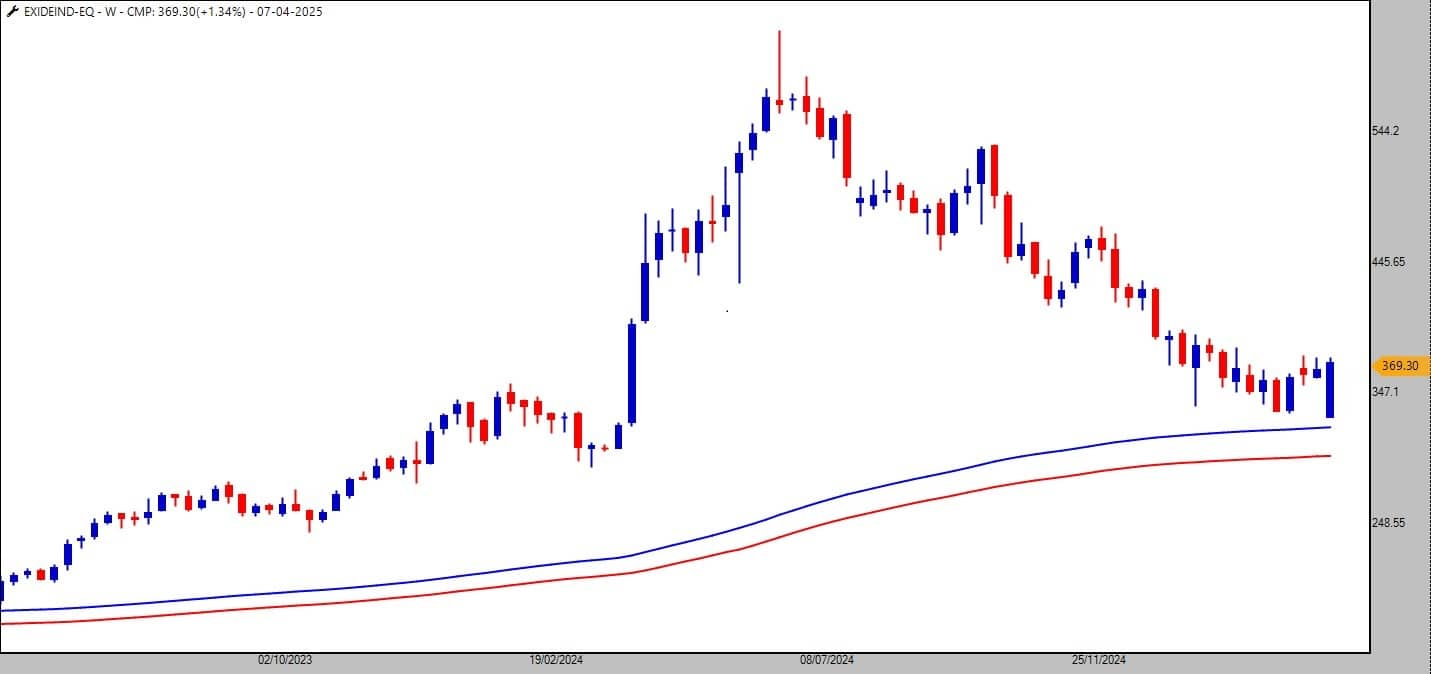
After months of consolidation and weakness, the stock appears to be reversing from the lower bounds of its 200WEMA Channel—a zone it has respected over multiple market cycles. The Bullish Belt Hold pattern near the support zone signals the potential reversal.
Just like MRF, this structural bounce from a long-term support level increases the probability of a trend reversal, especially when supported by broad-based bullish cues from the sector and the index.
With a potential bottom, Exide offers an interesting risk-adjusted trade setup for mid- to long-term traders.
Time to Rethink Volatility
In turbulent times, headlines and emotions can easily sway one. However, for those who stay grounded in process and pattern recognition, such volatility often plants the seeds of future opportunities.
The Nifty Auto Index may well be on the verge of a reversal, with stocks like MRF and Exide Industries lining up as early beneficiaries. While confirmation is always key, the setup is promising—and those watching closely may find themselves ahead of the next big move.
Note: The purpose of this article is only to share interesting charts, data points and thought-provoking opinions. It is NOT a recommendation. This article is strictly for educative purposes only.Disclaimer: The views and investment tips expressed by investment experts on Moneycontrol.com are their own and not those of the website or its management. Moneycontrol.com advises users to check with certified experts before taking any investment decisions.

Discover the latest Business News, Sensex, and Nifty updates. Obtain Personal Finance insights, tax queries, and expert opinions on Moneycontrol or download the Moneycontrol App to stay updated!
Find the best of Al News in one place, specially curated for you every weekend.
Stay on top of the latest tech trends and biggest startup news.


