The Nifty snapped a two-day fall and ended higher on August 28 aided by positive global cues. At close, the index was up 40.3 points at 19,306.1. Volumes on the NSE were lower than the recent average. The broad market indices gained more than the Nifty even as the advance decline ratio stayed above 1:1.
At present, the Nifty is hovering on its 50-day EMA (exponential moving average) support placed at 19,285. The index is down by almost 700 points from its all-time high of 19,991 made on July 20. However, during this correction phase for the benchmark index, Smallcap and Midcap stocks have done exceptionally well.
At present, the Nifty Midcap and the Smallcap Indices are couple of percentages away from their respective all-time highs. There are more than 83 percent of stocks in NSE500 trading above their 200 DMA, which indicates strong market breadth. There are many stock-specific trading opportunities that can be found during the trading sessions.
As far as the Nifty is concerned the 19,500-19,600 band is a strong resistance zone. Below 50 DEMA, far support for the Nifty is seen in the range of 19,050-19,100, derived from an upward sloping trendline adjoining swing highs of October 2021(18,604) and December 2022 (18,887).
The benchmark index is likely to consolidate unless we see violation of 19,050-19,600 band in the Nifty. However, during this consolidation phase, we expect many stocks to perform well from the mid and small cap space.
Among sectors, railways, infra, pharma, media and PSU banks are expected to perform well in the coming days.
Here are three buy calls for next 2-3 weeks:
IRCTC: Buy | LTP: Rs 678 | Stop-Loss: Rs 629 | Target: Rs 748 | Return: 10 percent
The Cup and Handle Pattern breakout is observed on the daily chart of Indian Railway Catering & Tourism Corporation (IRCTC). Price breakout is accompanied with rising volumes.
The stock price is trading above its 20, 50 and 200 DMA, indicating bullish trend on all time frames. Stock price has broken out from bullish Inverted Head and Shoulder pattern on the weekly chart. Indicators and Oscillators like MACD (moving average convergence divergence) and RSI (relative strength index) have turned bullish on the daily charts.

India Glycols: Buy | LTP: Rs 757.90 | Stop-Loss: Rs 664 | Target: Rs 850 | Return: 12 percent
The stock price has broken out from downward sloping trendline on the weekly charts. Price breakout is accompanied with jump in volumes.
The stock price has been forming higher tops and higher bottoms on daily charts. Indicators and oscillators have turned bullish on the weekly chart.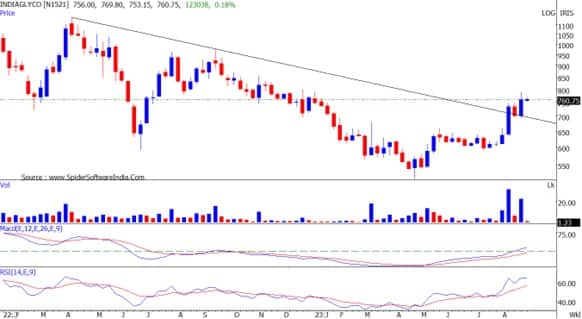
Jubilant Pharmova: Buy | LTP: Rs 466.9 | Stop-Loss: Rs 430 | Target: Rs 540 | Return: 16 percent
The stock price has broken out from bullish Cup and Handle pattern on the weekly chart. Stock has broken out from the consolidation which held in last two weeks.
The stock is placed above all important moving averages, which indicates bullish trend on all time frame. Indicators and oscillators have turned bullish daily and weekly charts.

Disclaimer: The views and investment tips expressed by investment experts on Moneycontrol.com are their own and not those of the website or its management. Moneycontrol.com advises users to check with certified experts before taking any investment decisions.

Discover the latest Business News, Sensex, and Nifty updates. Obtain Personal Finance insights, tax queries, and expert opinions on Moneycontrol or download the Moneycontrol App to stay updated!
Find the best of Al News in one place, specially curated for you every weekend.
Stay on top of the latest tech trends and biggest startup news.