
Benchmark equity index Nifty50 witnessed a smart recovery in the last two trading sessions after registering an intraday low of 17,043 on February 8. On February 9, inspired from its previous day's recovery, the index witnessed a gap up opening and traded above 17,350 levels throughout the day and a last hour surge in the prices helped Nifty close above 17,450 levels with over one percent gain on the daily time frame.
Nifty50 formed a bullish Hammer candlestick pattern on February 8 and prices have confirmed its bullish pattern validity by closing above its high in the next immediate trading sessions on the daily interval.
In addition, on the intraday charts, the Nifty is holding higher and high higher bottom formation which is broadly positive. On an hourly chart, the index has been trading above 9 & 21 – DMA (daily moving average) with the positive crossover which suggests strength for the next session.
A bullish pole flag pattern on the weekly time frame seems to have completed its throwback near 61.80 percent Fibonacci retracement and the uptrend is most likely to stretch the prices further higher.
From here on 17,000 levels will act as immediate support for the Nifty50 and if prices slip below this level then 16,700 will be the next support zone for the index. The upper band is capped near 17,850 levels for the time being.
Here are two buy calls for next 2-3 weeks:
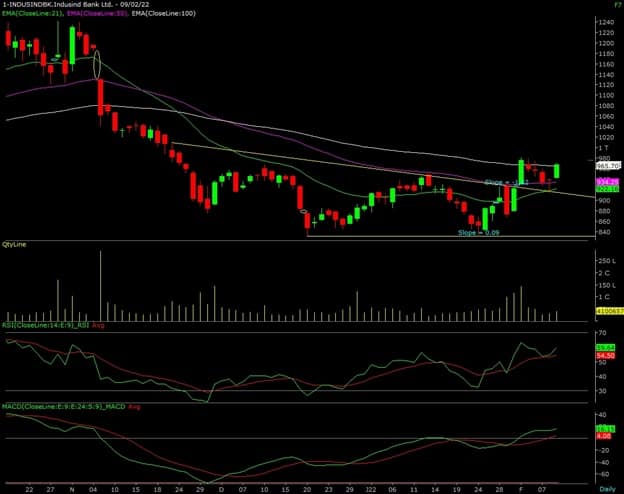
IndusInd Bank: Buy | LTP: Rs 967.15 | Stop-Loss: Rs 935 | Target: Rs 1,027 | Return: 6 percent
The prices were trading in an ascending triangle formation for the past more than two months and have formed a trendline resistance at Rs 900 levels.
IndusInd Bank has broken out of an ascending triangle pattern at Rs 975 levels on February 2 and the prices have registered a decisive breakout that suggests a change in the trend from sideways to upside. From the last four trading sessions, prices have given a throwback near its trendline support, which is placed near Rs 900 levels.
Stock is trading above its 21, & 50-day exponential moving averages on the daily time frame, which is positive for the prices in the near term.
The MACD (moving average convergence divergence) indicator is reading above its centerline with a positive crossover above its signal line. Momentum oscillator RSI (14) (relative strength index) is reading in a higher high higher low formation near 60 levels which indicates positive momentum will like to continue ahead.
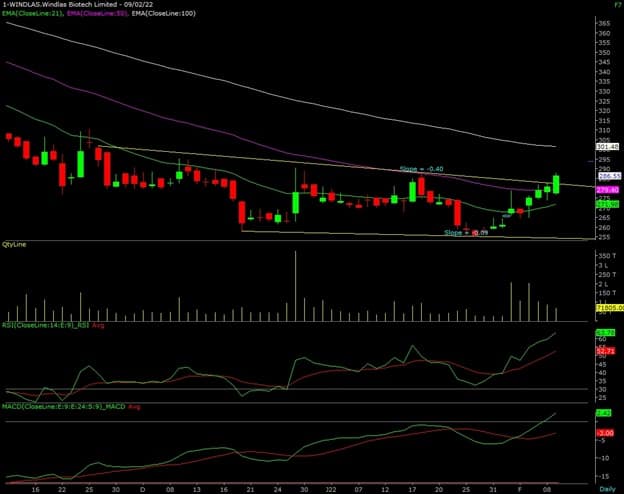
Windlas Biotech: Buy | LTP: Rs 286.55 | Stop-Loss: Rs 272 | Target: Rs 310 | Return: 8 percent
The prices were trading in a lower high lower low formation since past six months and have formed a consolidation rectangle pattern and prices are trading within the range of Rs 255 – 275 levels from last two months.
Windlas Biotech has broken out of a rectangle pattern at Rs 286 levels on February 9 and the prices have registered a decisive breakout that suggests a change in the trend from sideways to upside.
The stock is trading above its 21, & 50-day exponential moving averages on the daily time frame, which is positive for the prices in the near term. The prices seem to complete its accumulation phrase and prices may resume its uptrend soon.
The MACD indicator is reading above its centerline with a positive crossover above its signal line. Momentum oscillator RSI (14) is reading above 60 levels which indicates positive momentum will like to continue ahead.
Disclaimer: The views and investment tips expressed by investment experts on Moneycontrol.com are their own and not those of the website or its management. Moneycontrol.com advises users to check with certified experts before taking any investment decisions.

Discover the latest Business News, Sensex, and Nifty updates. Obtain Personal Finance insights, tax queries, and expert opinions on Moneycontrol or download the Moneycontrol App to stay updated!
Find the best of Al News in one place, specially curated for you every weekend.
Stay on top of the latest tech trends and biggest startup news.