


The week gone by was sideways yet choppy for the domestic markets. The benchmark indices remained stuck in a broad range and ultimately closed flat after too much of hustle. The Nifty made an attempt for the recovery but failed to sustain at higher levels and breached the support of 17,775. Eventually it ended flat with a marginal change.
Although the Nifty breached 17,775, it sustained there for negligible amount of time and recovered sharply. As a result, we are witnessing a Doji candlestick pattern on the weekly chart of Nifty spot. At the same time, we are also witnessing multiple bottoms near 17,775.
Thus, for the coming week, 18,150 mark which is almost the high of Doji would be a trigger point for positive momentum whereas a close below 17,775 would drag the index further. As of now there seems to be a possibility of Budget relief rally but even that would get confirmed above 18,150.
Even the Nifty Bank index respected its support of 41,500 and we are witnessing similar kind of Doji on the weekly chart. Thus, the trend deciding range for coming week might be 42,700 – 41,500. A breach of the lower range might drag the index towards 40,000 mark since that could be a psychological support. The bulls would be back in action only above 42,700.
Here are three buy calls for next 2-3 weeks:
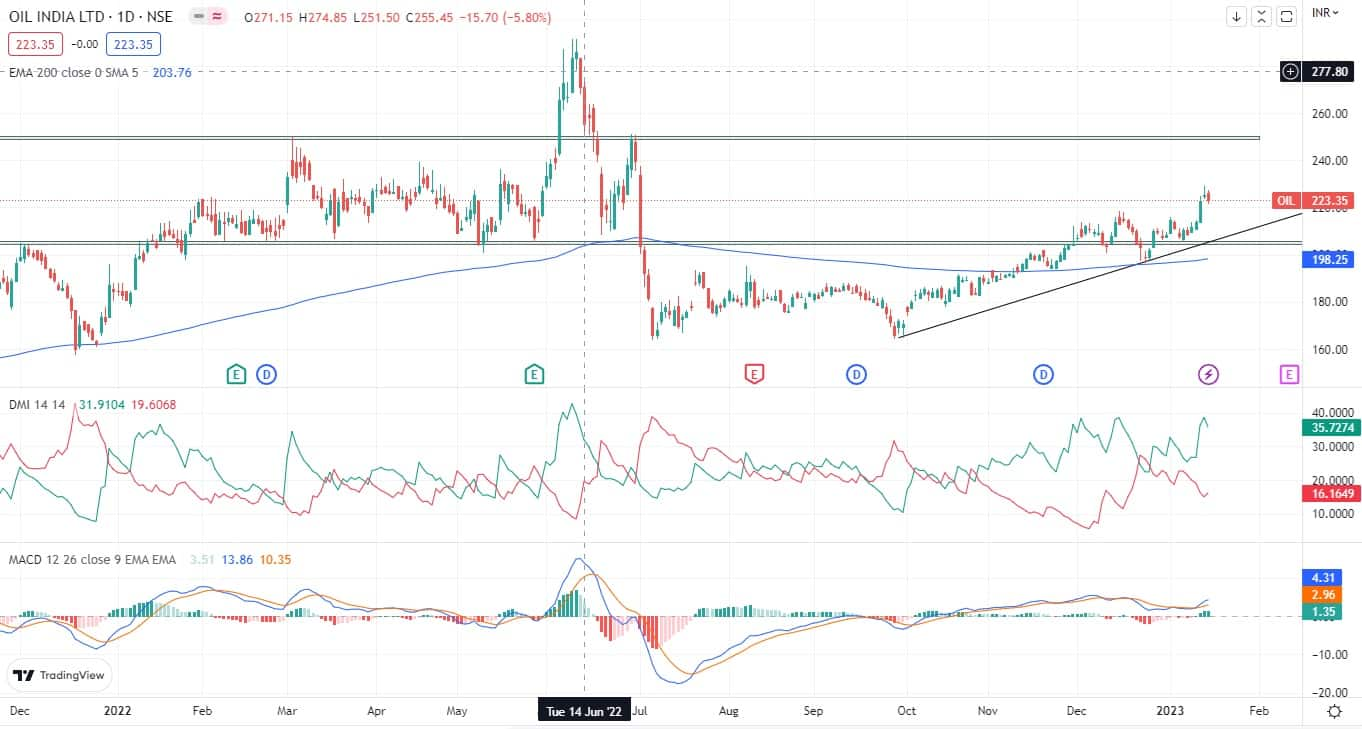
Oil India: Buy | LTP: Rs 223 | Stop-Loss: Rs 210 | Target: Rs 250 | Return: 12 percent
Since the last four months, the said counter has been making higher highs and higher lows structure. Recently it broke its previous swing high of Rs 218.60 along with the four-month-old trendline is maintained and currently is sustaining above it 200 DEMA (day exponential moving average) thus hinting upside in the counter.
On the indicator front, daily DMI (directional movement index) is in bullish mode and also it broke its previous swing thus indicating bullishness in the counter. Also, daily MACD (moving average convergence divergence) has made bullish cross above zero line thus giving extra confirmation for upside in the said counter.
One can buy in small tranches around Rs 221-224 and another around Rs 216-218, with a target at around Rs 250 and stop-loss at Rs 210.
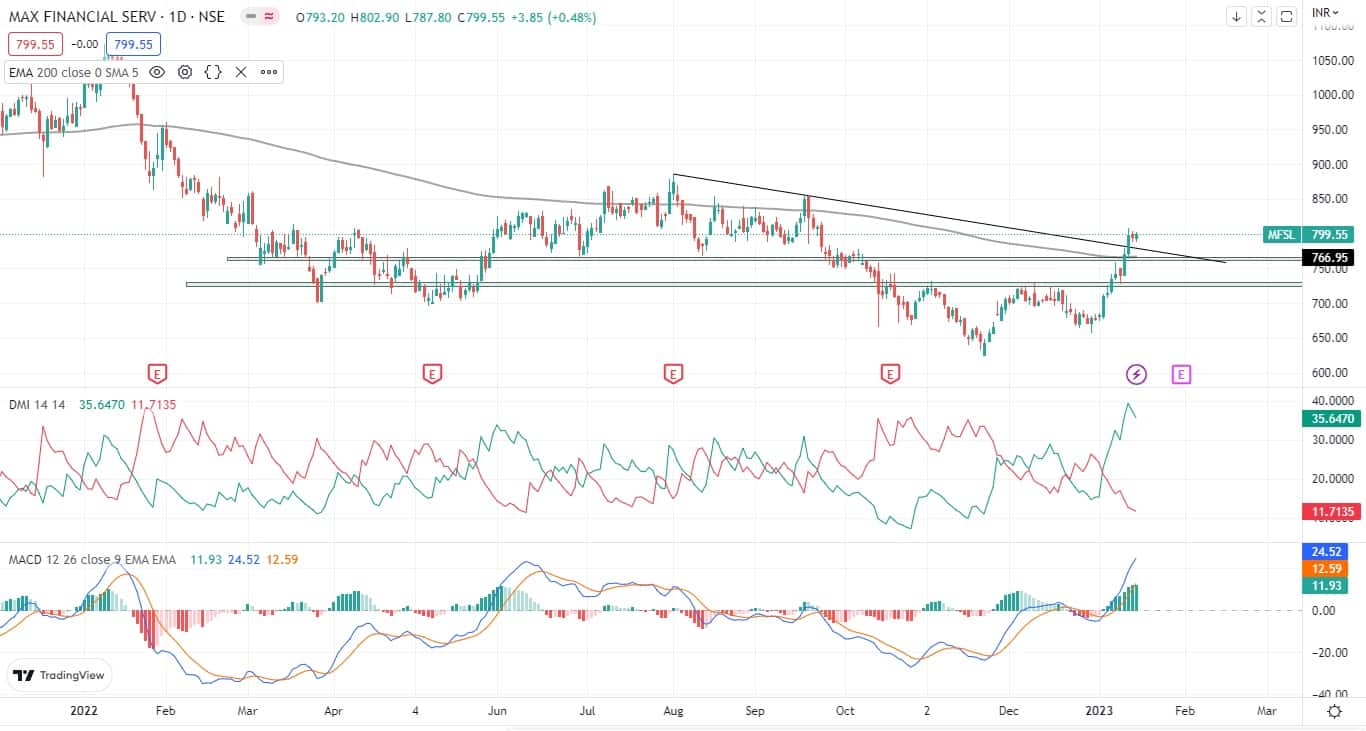
Max Financial Services: Buy | LTP: Rs 800 | Stop-Loss: Rs 740 | Target: Rs 900 | Return: 12.5 percent
For the last 5 months approximately, the said counter is making lower highs and lower lows structure. Recently it has started changing its structure by making higher highs and higher lows, and also it broke 12 months old trendline.
At the current juncture, it has sustained above 200 DEMA . What is more interesting is that buying volume is picking up from lower levels. Since last two weeks, we witnessed some nice buying interest.
On the indicator front, daily DMI (directional movement index) has given a bullish cross along with daily MACD displays bullish cross near zero-line hinting upside in the counter.
One can buy in small tranches around Rs 795-800 and another around Rs 765-775, with a target at around Rs 900 and stop-loss at Rs 740.
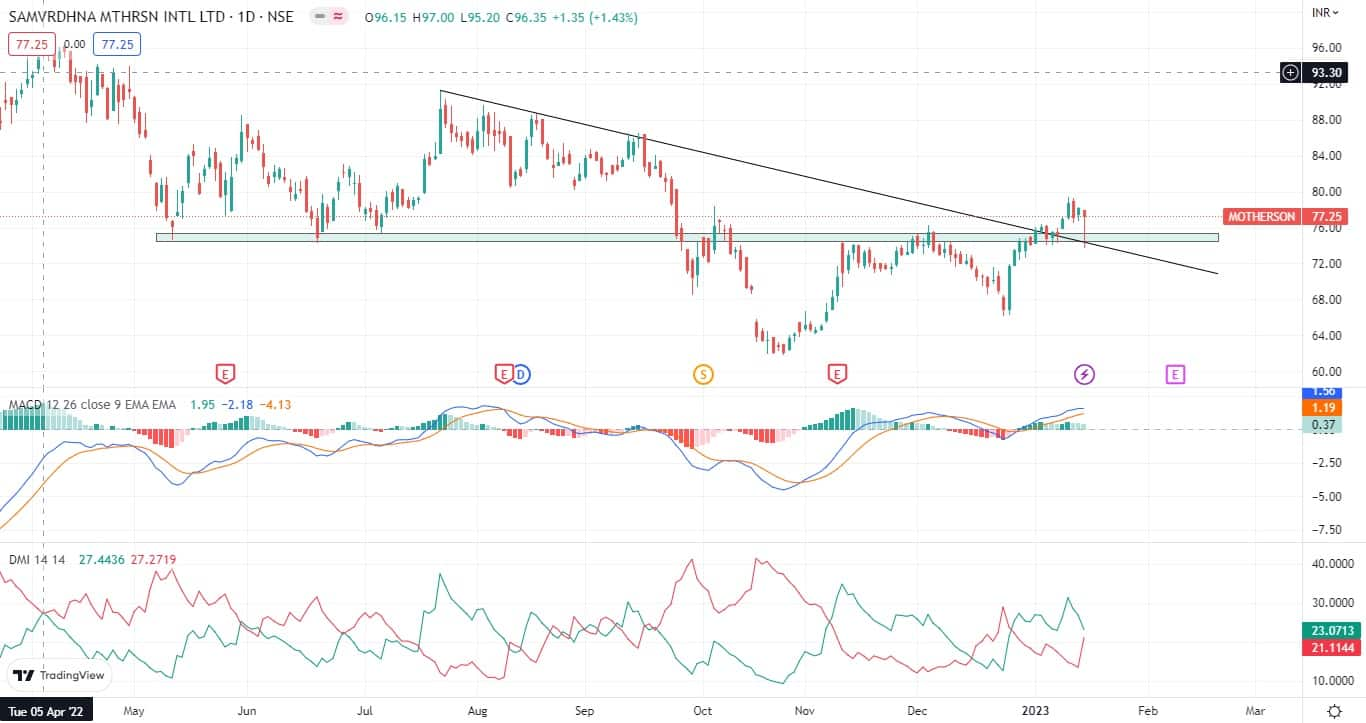
Samvardhana Motherson International: Buy | LTP: Rs 77 | Stop-Loss: Rs 69 | Target: Rs 88 | Return: 14 percent
Since the last 3 months, the said counter has been making higher highs and higher lows structure. Recently it broke its previous swing high of Rs 76.30 along with the 6-month-old trendline was broken and currently is sustaining above it thus hinting upside in the counter. Moreover, Hammer candle was seen taking support near 100 DEMA which is looking lucrative.
On the indicator front, daily DMI is in bullish mode and also it broke previous swing high thus indicating bullishness in the counter.
One can buy in small tranches around Rs 76-77 and another around Rs 73-74. Target is expected around Rs 88 and stop-loss would be Rs 69.
Disclaimer: The views and investment tips expressed by investment experts on Moneycontrol.com are their own and not those of the website or its management. Moneycontrol.com advises users to check with certified experts before taking any investment decisions.

Discover the latest Business News, Sensex, and Nifty updates. Obtain Personal Finance insights, tax queries, and expert opinions on Moneycontrol or download the Moneycontrol App to stay updated!
Find the best of Al News in one place, specially curated for you every weekend.
Stay on top of the latest tech trends and biggest startup news.


