


Mid caps may be worst hit with the unwind of the yen-carry trade, according to a report by Elara Capital.
The report stated that a big portion of the yen-denominated flows--25 percent of the total flows that came to India--went into mid-caps, stated the report.
A yen-denominated unwind is a real threat to India and, going by previous experience, the unwind could damage the market breadth significantly, according to the report.
Also read: Decoding Economics: A 2019 IMF paper predicted how the yen carry trade would unwind
Here are eight interesting charts and tables from the report to show how the yen-carry unwind can affect the Indian markets.
1. India saw sharpest rise in JPY AUM
The global yen carry trade started accelerating from January 2023...
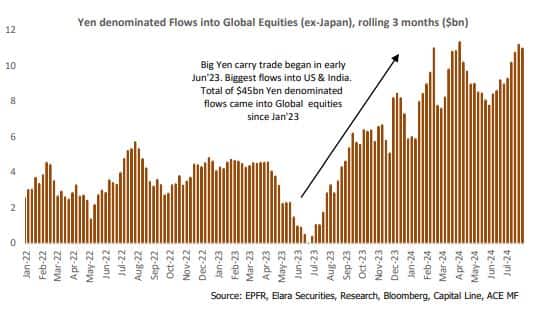
... and India saw the sharpest rise in the currency-denominated flows.
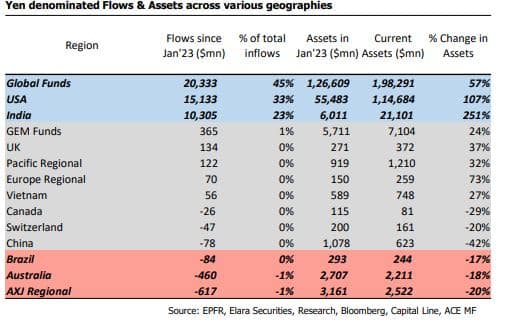
The report stated: "Currently, India’s JPY denominated assets are almost $21bn which have increased from $6bn in Jan’23. Total FII holding in India at end of Jun quarter is $945bn. Current JPY denominated holding in India is around 2.2%."
Inflows into midcap funds began in April 2023 and sharply expanded until Sep’23. This period also saw the strongest and sharpest move in midcap index, which rallied by 42 percent without any round of strong correction.
The report added that, since then, the JPY flows in India have also shifted to large cap funds.

3. Earlier encounter with an unwind
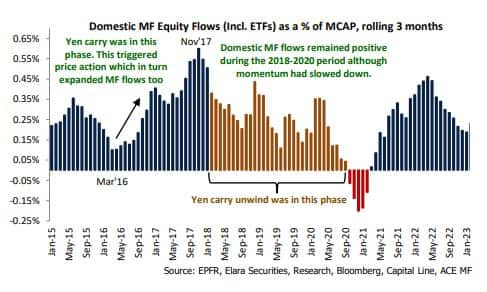
The analysts wrote that the previous big leg of the yen-carry trade in India was between March 2016 to January 2018, when yen depreciated versus INR by around 16 percent.
In March 2016, India started seeing yen inflows that caused a big breadth expansion until Jan 2018. Then, 10 percent of total inflows went into midcap funds. This triggered big inflows into domestic MFs.
Once the Yen unwind began in January 2018, there was a bigger damage done to the market breadth for a few years. Yen appreciated by almost 30 percent over next two years.
"Interestingly, the domestic flows never turned negative in that phase when Yen unwind was taking place although the momentum had slowed down," said the report.

This time, the bigger leg of the yen-carry trade began in March 23, and a large portion--25 percent of the total flows--went into mid-caps. Since then, domestic mutual-fund inflows also started accelerating in mid and smallcap schemes (mostly chasing price momentum). Average monthly smallcap flows since Mar 2023 is 1.5x v/s prior 2-years average.
The analysts could not get industry-level data for all the funds but, out of the total yen-denominated assets of $21 billion, they could cover $14 billion or around 70 percent of the total.
They found that the largest flows went into banks and software. But, they added, as percentage of market cap of these sectors, the flows may not have been that significant.
Capital goods saw the third largest inflows with the current exposure of the sector at $1.5 billion.

Flows have been very small in consumer durables, insurance, food beverage and tobacco, and household and personal products. Profit on these positions is also on the lower side. If the yen unwind trade continues then these could be least impacted sector purely on basis of their exposure.

The analysts wrote that the strongest indicator for this trade in India has been the movement of the INR/JPY rates. They noted that, whenever yen appreciated against INR, the market has corrected sharply.
"We had seen strong JPY appreciation cycles (v/s INR) in Apr’11-Jul’12, Jan’15-Jun’16, Jan’18 Dec’20 period. In all the 3 cases, Indian markets had seen a strong round of correction. In the current cycle too, the rates are reversing from similar zone."

Movement in INR/JPY rates can be a good proxy for understanding the direction of the trade. If rates continue to drift lower (JPY keeps appreciating against INR), then it could indicate a continuous pressure from unwind of this trade, said the report.
Discover the latest Business News, Sensex, and Nifty updates. Obtain Personal Finance insights, tax queries, and expert opinions on Moneycontrol or download the Moneycontrol App to stay updated!
Find the best of Al News in one place, specially curated for you every weekend.
Stay on top of the latest tech trends and biggest startup news.


