


The benchmark indices closed flat with a negative bias on December 18, with market breadth favouring bears. About 1,771 shares witnessed selling pressure, while 1,047 shares advanced on the NSE. The market may attempt a bounce back after a four-day losing streak, but sustainability will be key to watch. Below are some short-term trading ideas to consider:
Jay Mehta, Technical Research at JM Financial ServicesSRF | CMP: Rs 3,050.7
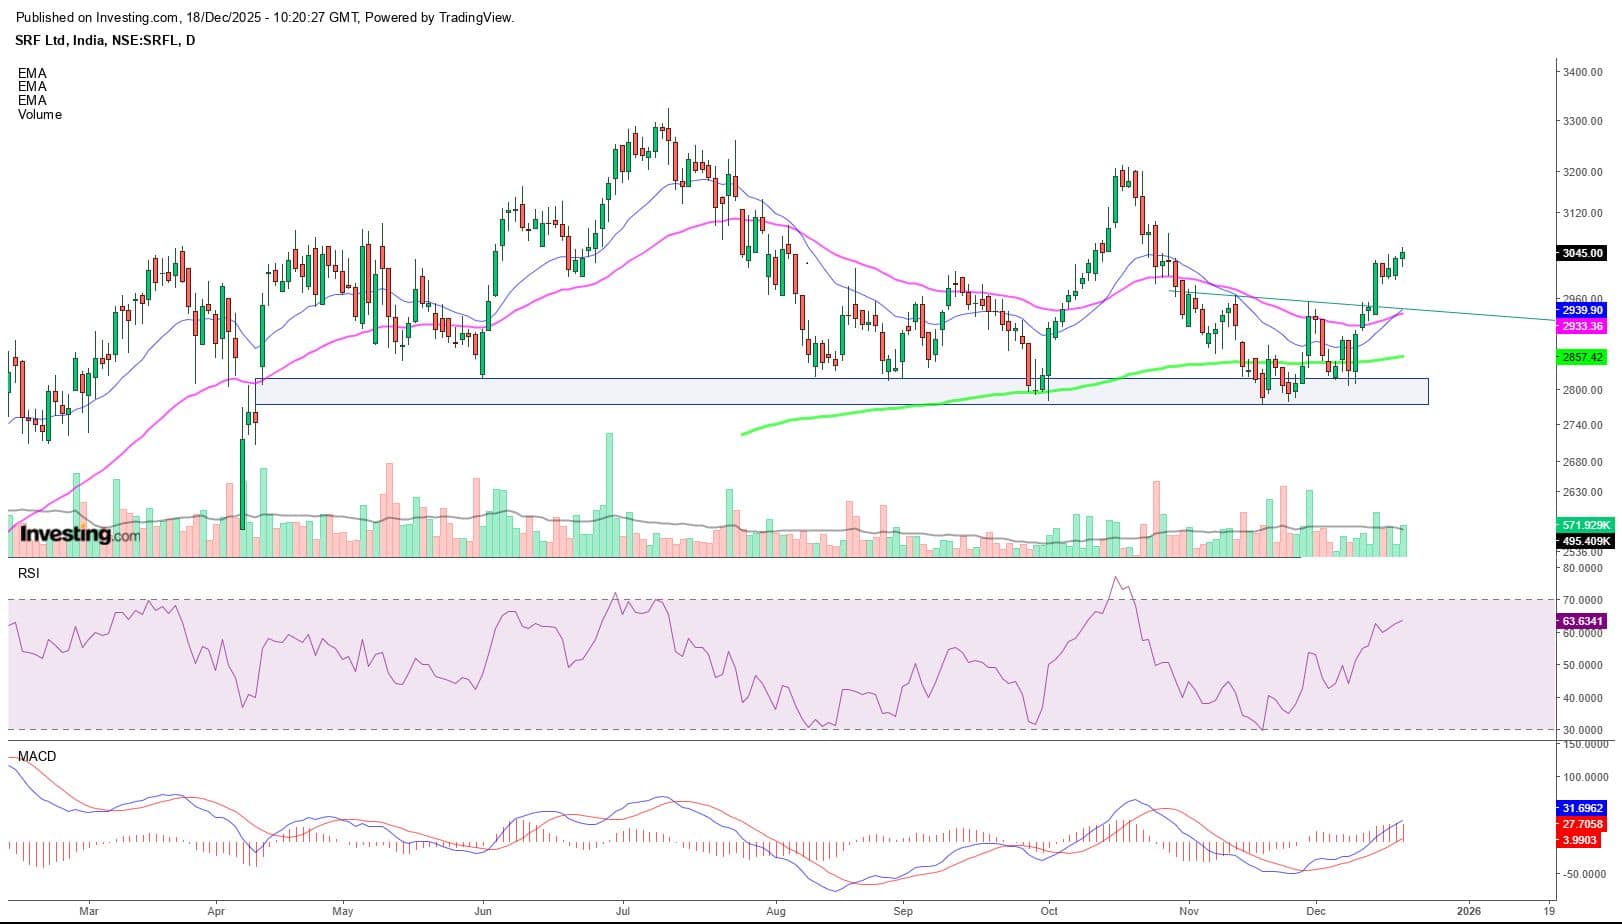
SRF built a solid base in the Rs 2,800–2,950 zone before breaking out above it on December 12. Post breakout, it consolidated tightly for three days before stepping higher again in the latest session.
Volume expansion supports the bullish move. The price is trading above all key EMAs, which are trending upward. Daily and weekly momentum indicators remain in bullish territory.
Strategy: Buy
Target: Rs 3,150, Rs 3,250
Stop-Loss: Rs 2,890
Ramco Cements | CMP: Rs 1,064
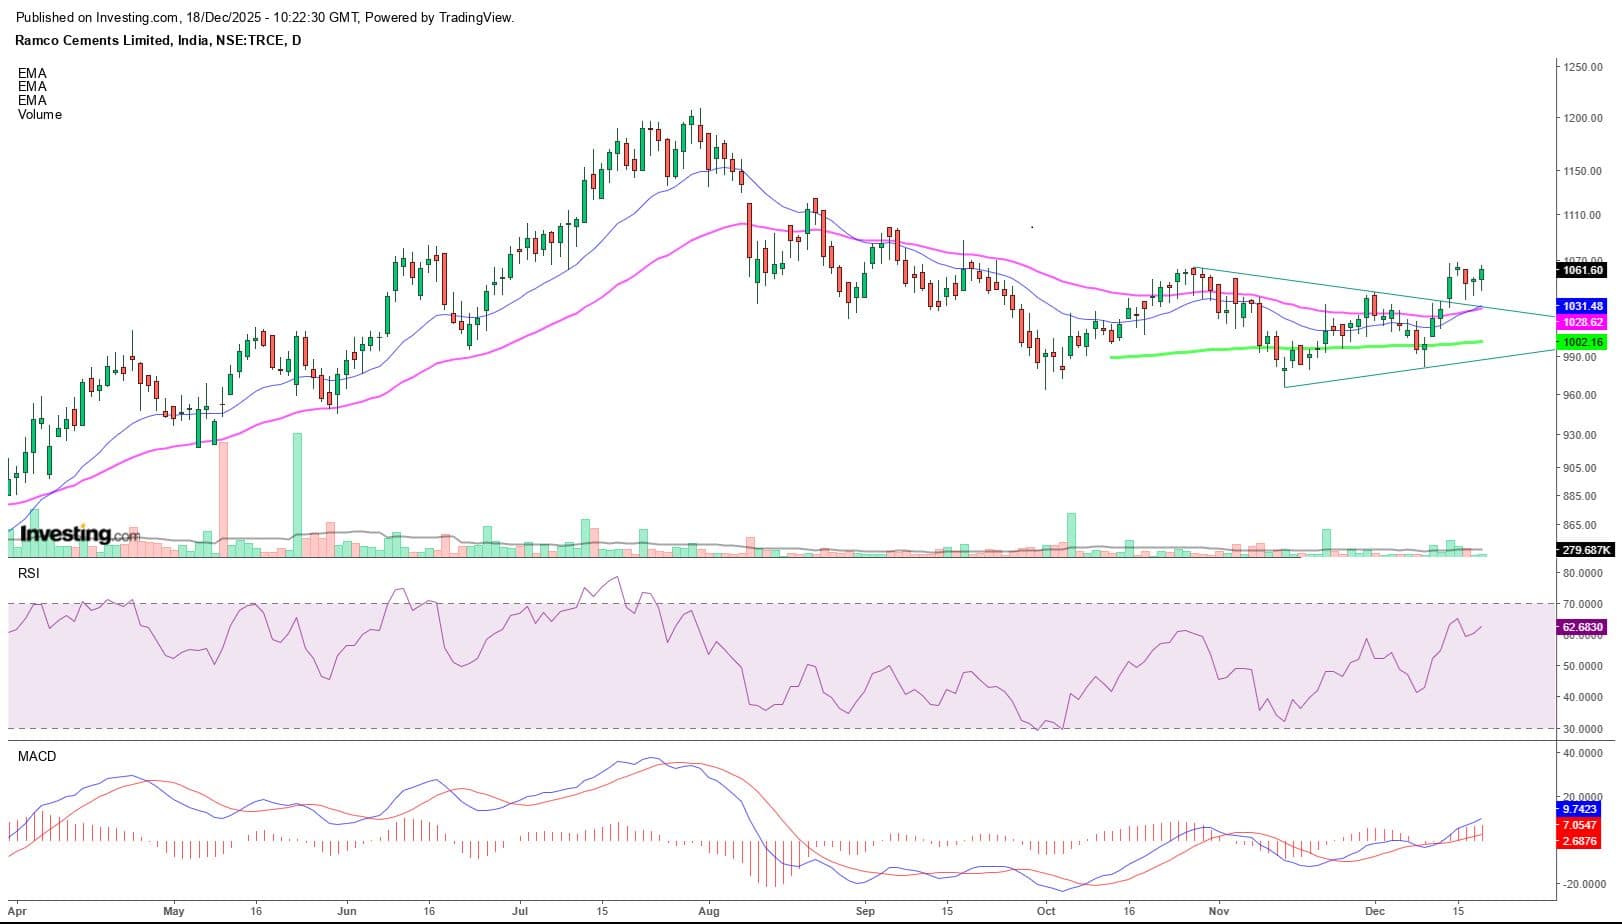
Ramco Cements delivered a bullish breakout above a triangular consolidation, followed by a retest of the breakout zone. The breakout was backed by strong volume, indicating solid participation.
The price is trading above all key EMAs and sloping upward, with daily and weekly momentum indicators supporting a bullish bias. A move above Rs 1,070 should accelerate the rally.
Strategy: Buy
Target: Rs 1,110, Rs 1,136
Stop-Loss: Rs 1,008
SBI Cards and Payment Services | CMP: Rs 848.15
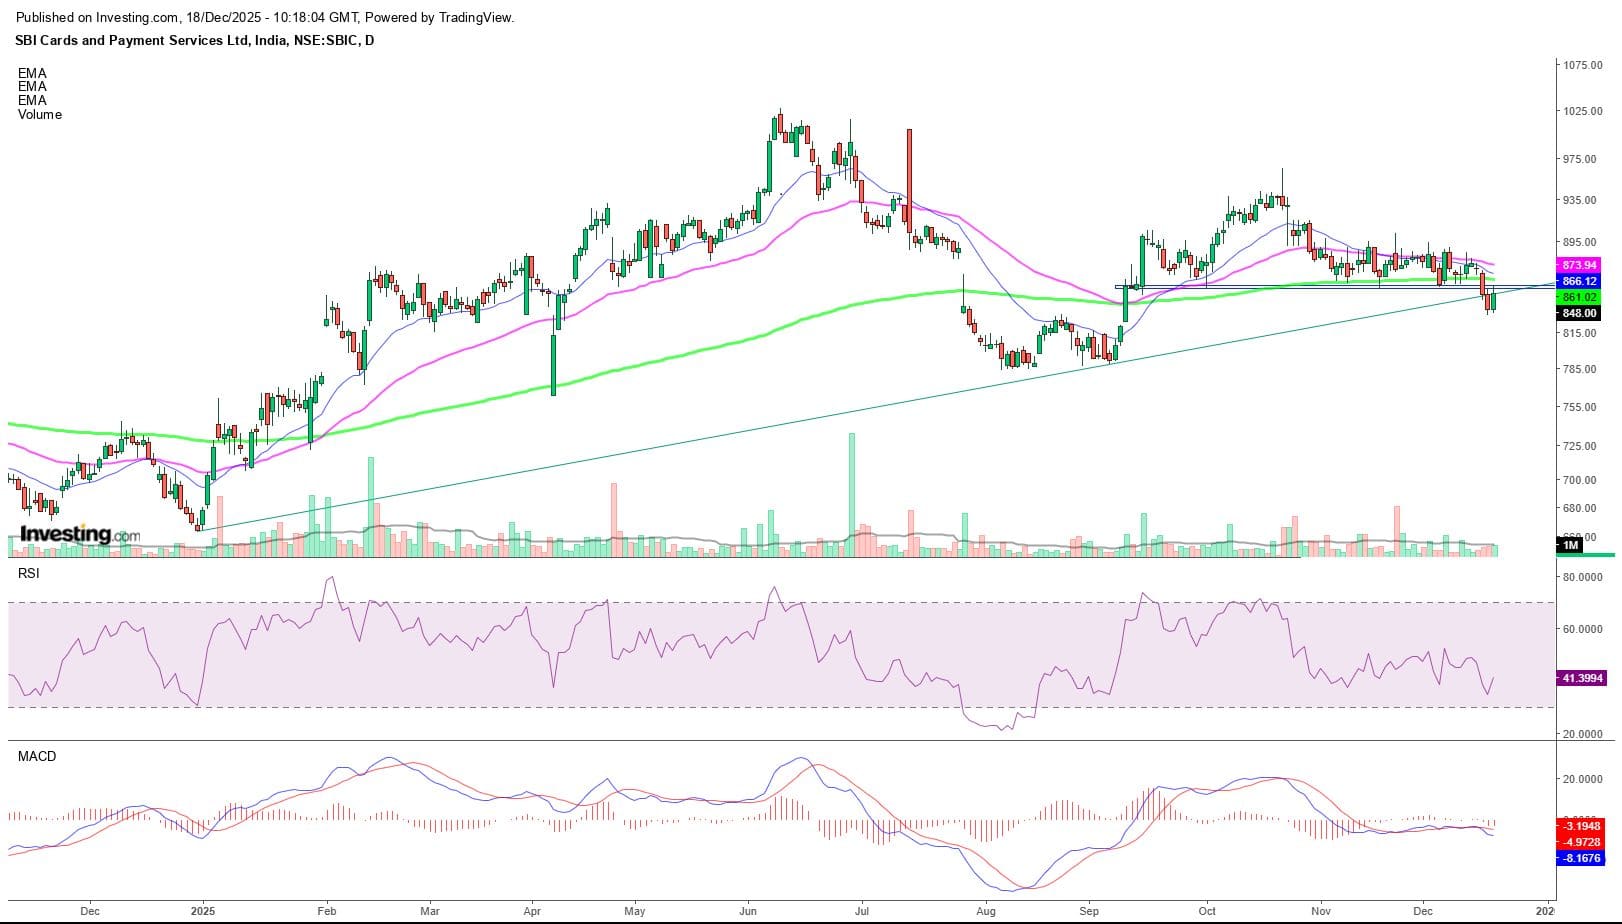
SBI Card broke down below key support in Wednesday’s session after over a month of narrow range-bound movement between Rs 850–900. Negative volume expansion during the breakdown supports a bearish bias. The price now trades below all key EMAs, which are sloping downward.
The stock has completed a bearish head-and-shoulders pattern and breached a long-term rising trend line. Daily and weekly momentum indicators confirm negative sentiment. The latest session retested the breakdown zone.
Strategy: Sell
Target: Rs 800, Rs 740
Stop-Loss: Rs 880
Om Mehra, Technical Research Analyst at Samco SecuritiesBSE | CMP: Rs 2,682.9
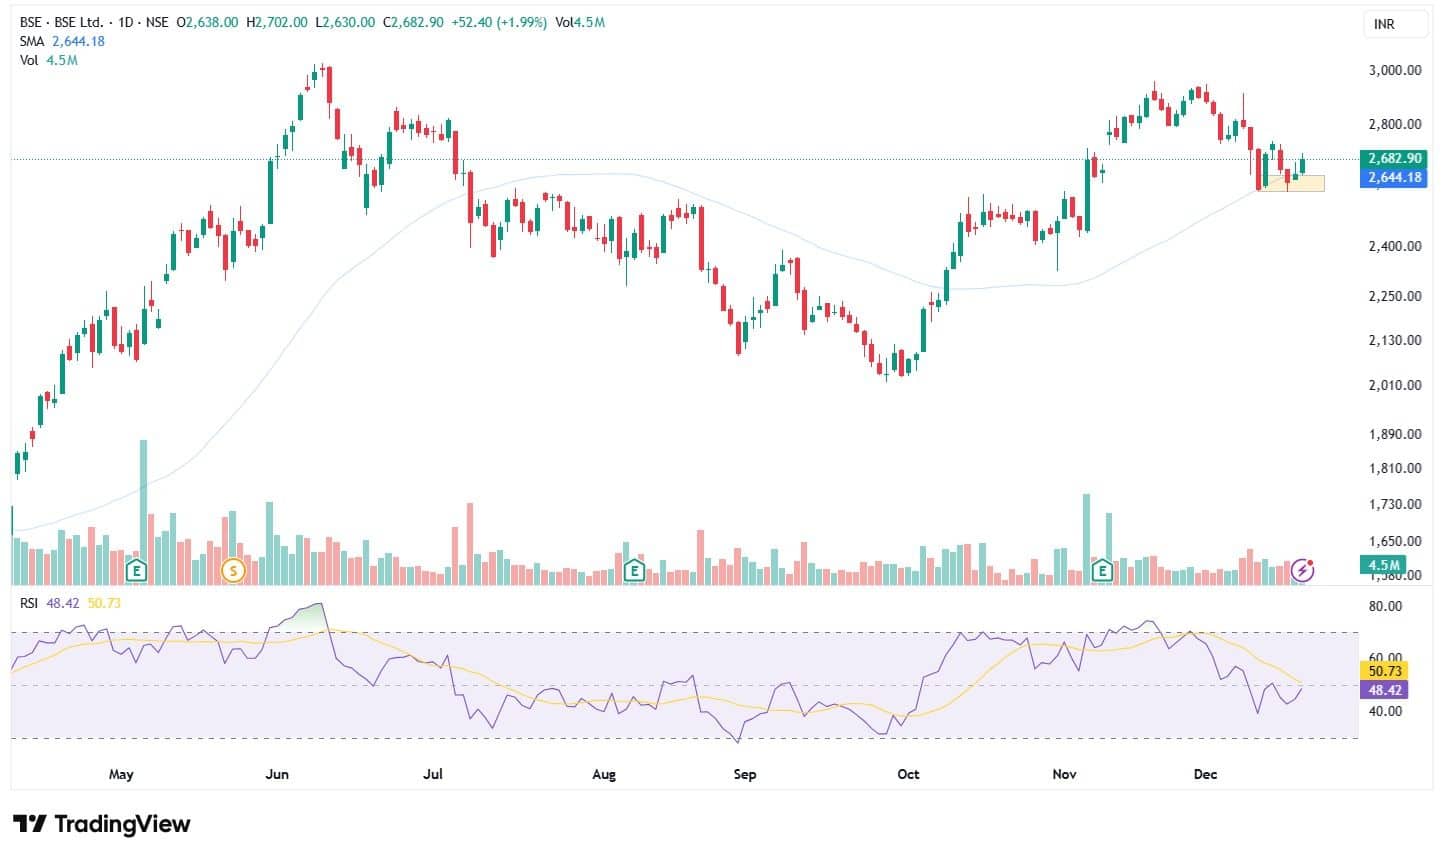
BSE is trading firmly above its rising 50-day SMA (Rs 2,645), which continues to act as a key medium-term support. The stock has witnessed a controlled pullback and is now consolidating with higher lows, indicating a pause rather than trend exhaustion. Recent candles reflect stability near the short-term moving average, suggesting that selling pressure is gradually getting absorbed at lower levels.
The daily RSI is placed near 48, hovering around the neutral zone after cooling off from the overbought region. As long as BSE sustains above the Rs 2,600–2,620 zone, the broader outlook remains bullish, while a move above Rs 2,720 could trigger a fresh upswing.
Strategy: Buy
Target: Rs 2,950
Stop-Loss: Rs 2,580
Aurobindo Pharma | CMP: Rs 1,209.30
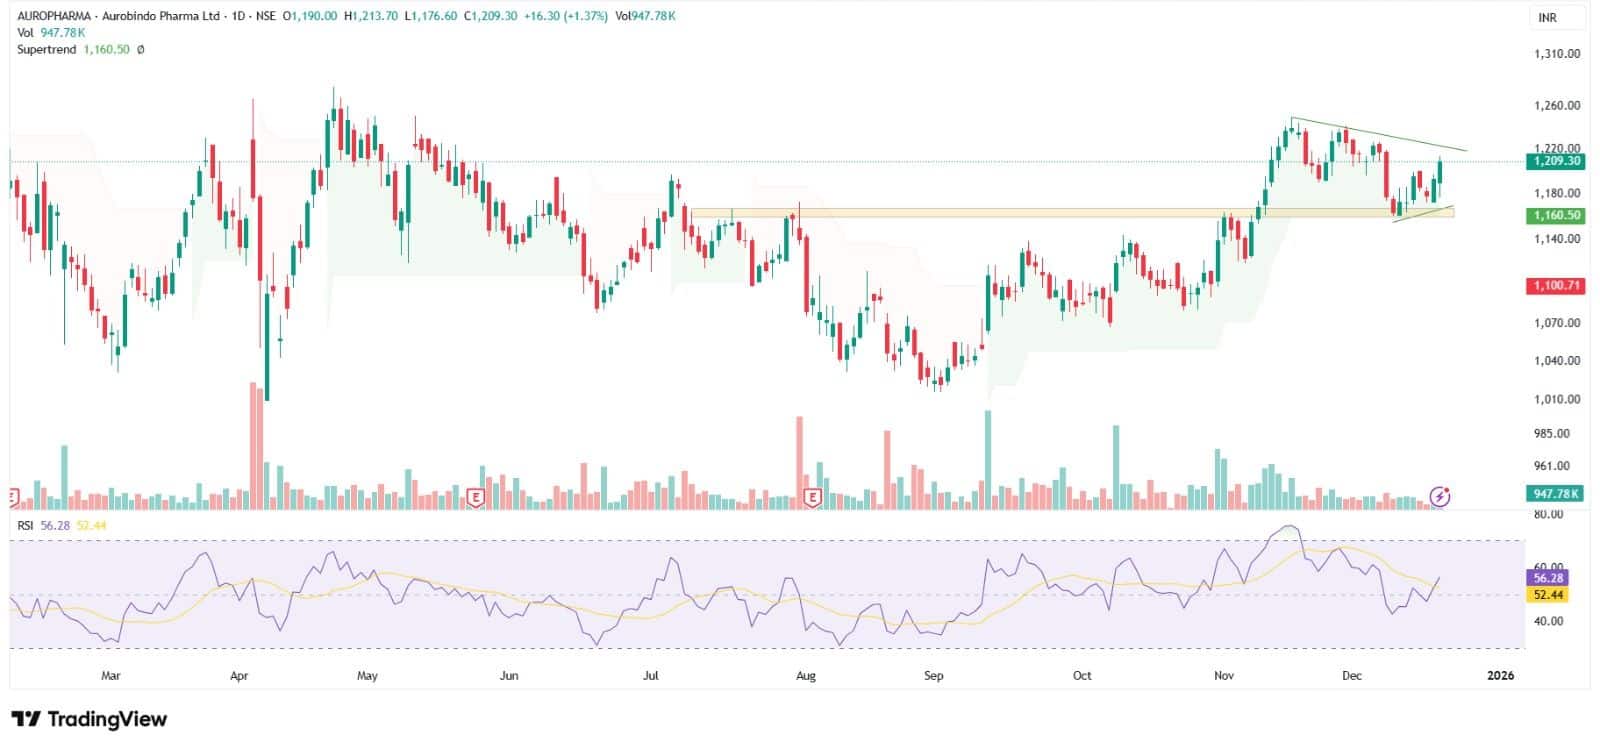
Aurobindo Pharma is extending its recovery after a strong breakout above the earlier consolidation zone around Rs 1,160, which now acts as an important support area. The stock has been forming higher highs and higher lows over recent weeks, reflecting steady upward traction.
The price is holding comfortably above the rising Supertrend support, indicating that the broader uptrend remains intact. The recent consolidation near the Rs 1,200–1,220 zone appears to be minor. The daily RSI is placed near 56, staying above the neutral zone and pointing toward sustained strength.
As long as the stock holds above Rs 1,190, the near-term outlook remains positive, while a decisive move above Rs 1,220 could lead to a continuation of the up-move toward higher levels.
Strategy: Buy
Target: Rs 1,280
Stop-Loss: Rs 1,165
Tech Mahindra | CMP: Rs 1,605.6
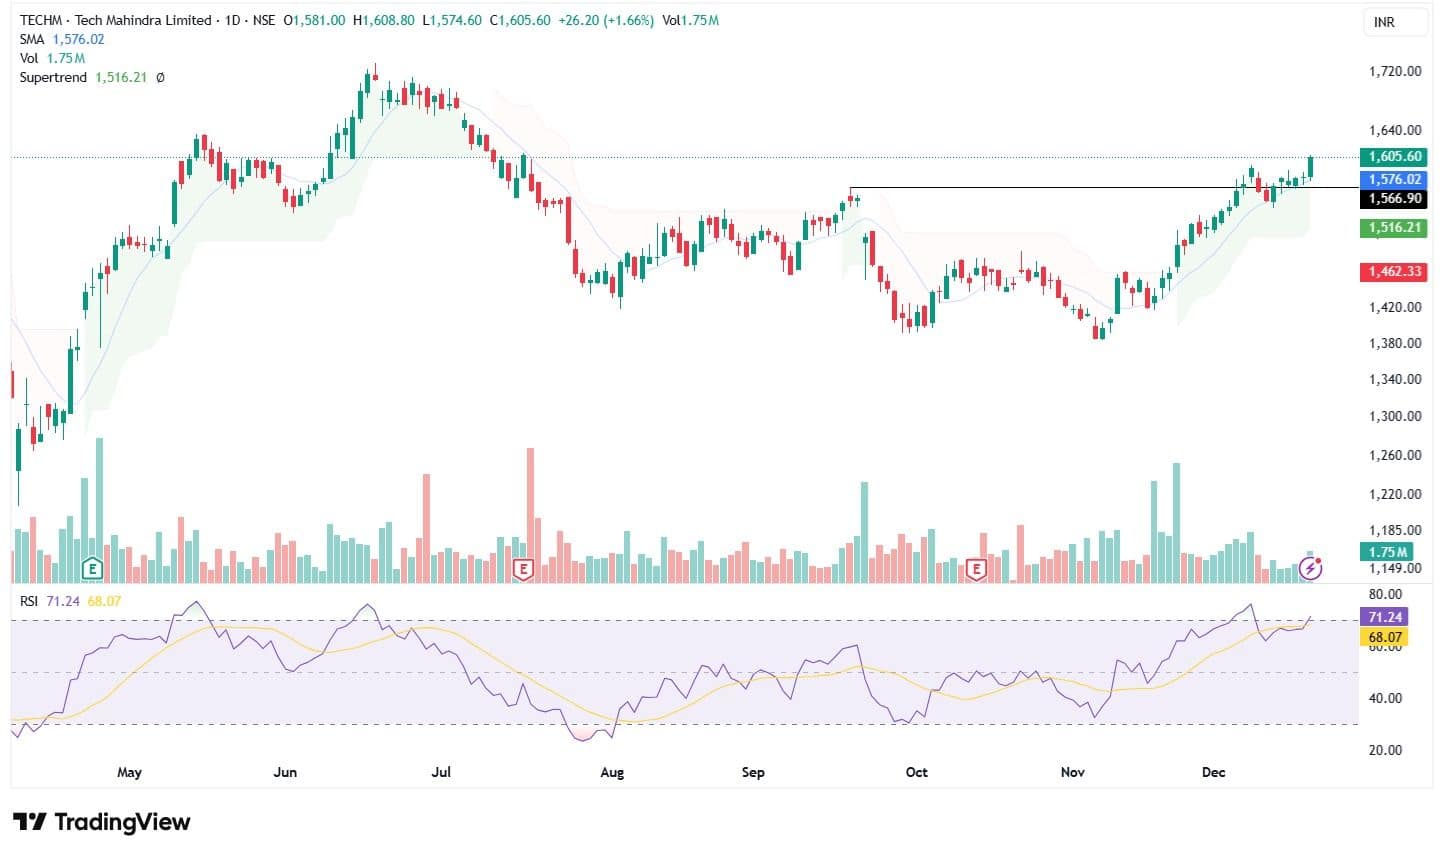
Tech Mahindra has witnessed a strong breakout above the Rs 1,600 level, supported by healthy volumes. The short-term moving averages are inclining higher and now act as strong medium-term support. The stock has decisively moved out of its earlier consolidation range and is forming higher highs on the daily chart, indicating improving trend strength. Recent candles reflect steady continuation with limited retracement, suggesting that upward momentum remains intact.
On the hourly timeframe, the Supertrend support near Rs 1,580 is acting as a short-term cushion against any decline. The daily RSI is placed near 71, reflecting strong momentum, while the MACD continues to sustain a bullish crossover. As long as the stock holds above the Rs 1,570–1,575 zone, the broader outlook remains positive, while a sustained move above Rs 1,620 could open the path for further upside.
Strategy: Buy
Target: Rs 1,680
Stop-Loss: Rs 1,545
Hitesh Tailor, Technical Research Analyst at Choice BrokingICICI Prudential Life Insurance Company | CMP: Rs 645.65
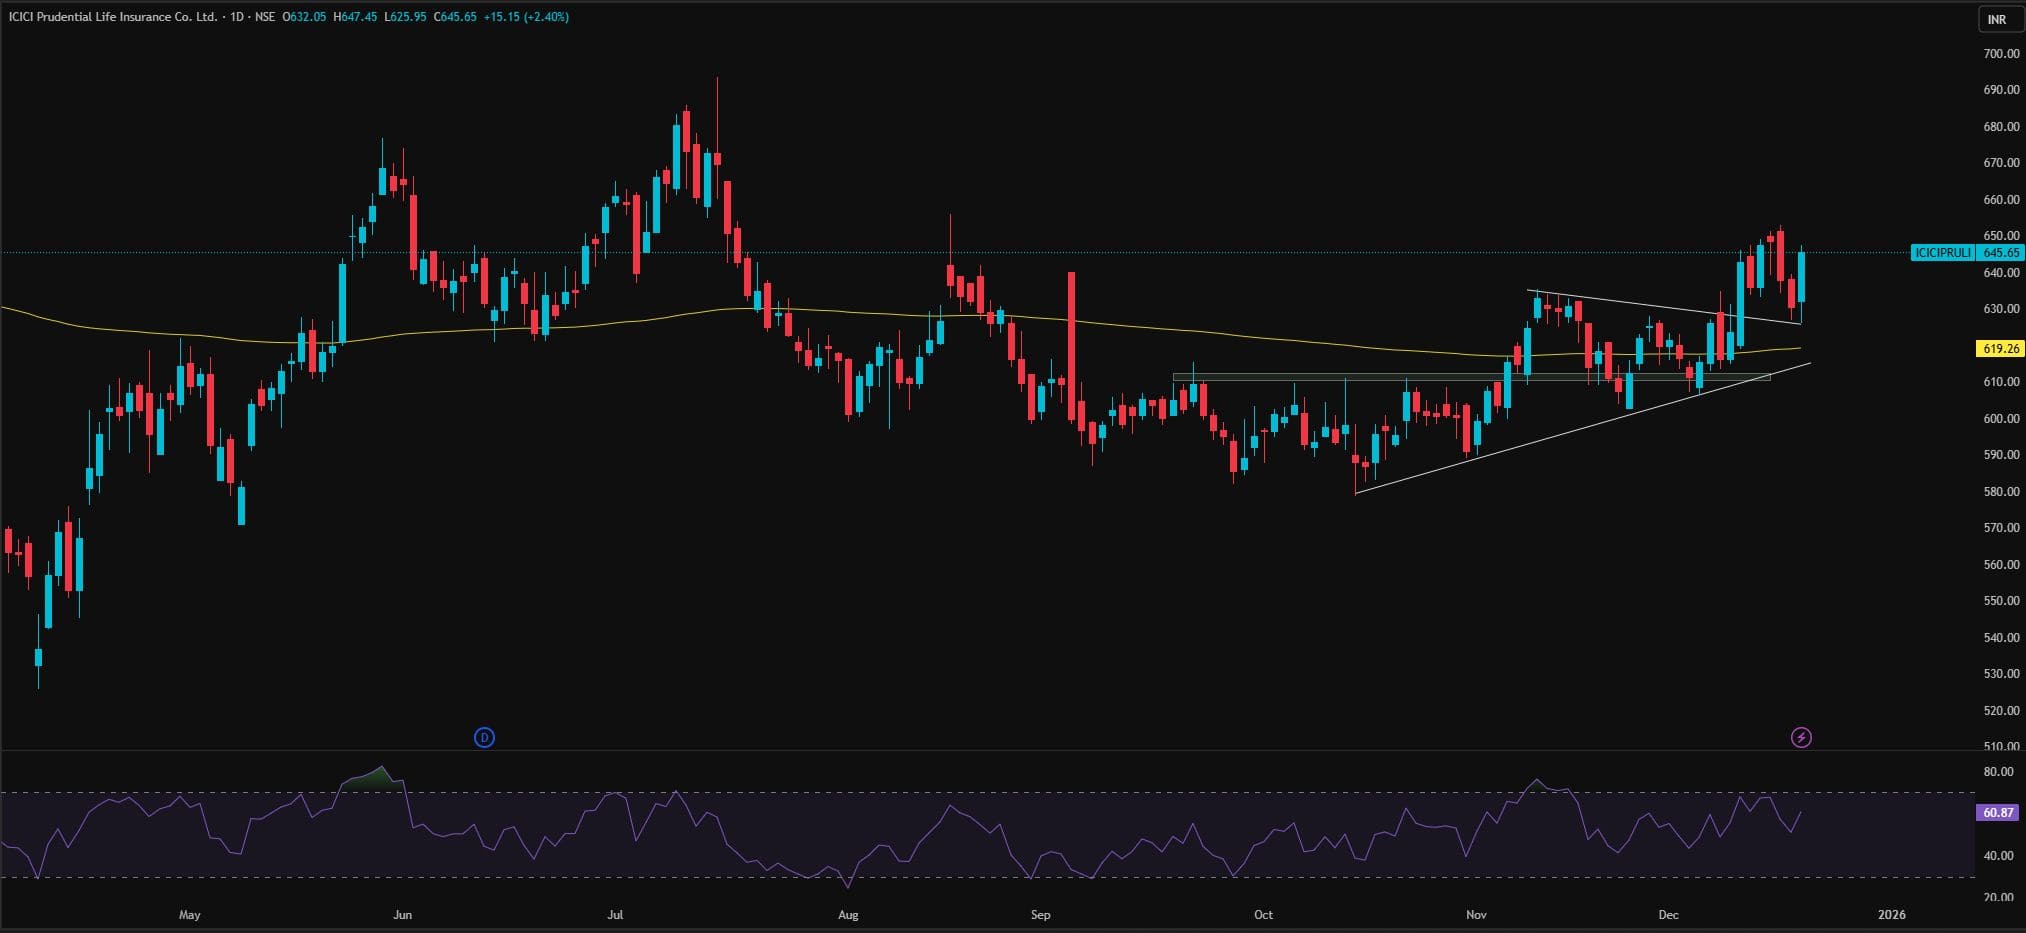
ICICI Prudential Life continues to trade above its key 20-day, 50-day, and 200-day EMAs, reinforcing the underlying bullish structure and suggesting that the broader trend remains intact.
From a price action perspective, the stock is forming a higher high and higher low structure on the daily chart, highlighting sustained demand at lower levels and gradual strengthening of momentum. On the downside, immediate support is placed around Rs 620, which aligns with the previous higher low and the 200-day EMA. Any dip toward this area is likely to attract fresh buying interest, keeping the overall bias positive.
On the upside, immediate resistance is seen near Rs 650, which marks the previous higher high. A decisive breakout and sustained move above this level could pave the way for further upside and continuation of the ongoing uptrend. The RSI stands at 60.87, comfortably placed in the bullish continuation range, indicating scope for further momentum.
Strategy: Buy
Target: Rs 700
Stop-Loss: Rs 615
APL Apollo Tubes | CMP: Rs 1,795.7
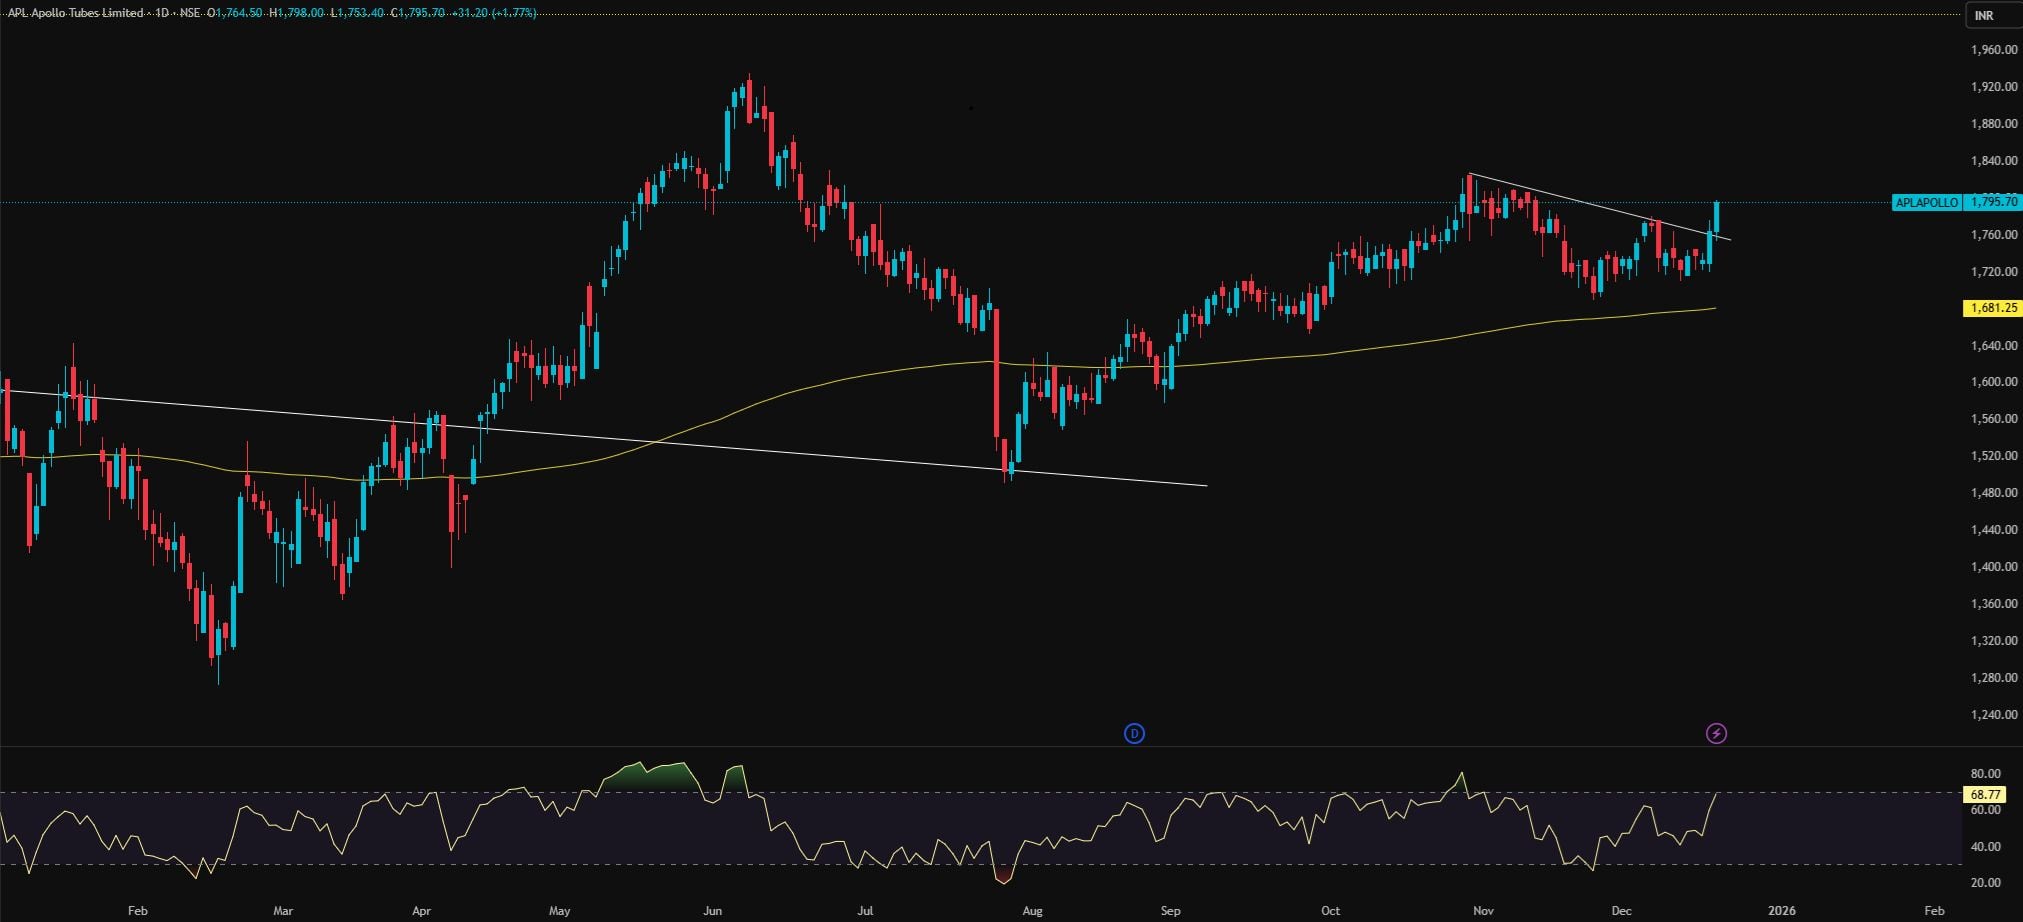
APL Apollo Tubes has recently witnessed a phase of sideways consolidation, indicating a period of equilibrium between buyers and sellers. The stock has now shown a clear breakout from this consolidation range and has started moving higher, signalling a revival of bullish momentum. This breakout reflects renewed buying interest and suggests the potential resumption of the broader uptrend after a healthy pause.
From a support perspective, the stock is taking strong support near the 100-day EMA, placed around Rs 1,720, which has acted as a reliable demand zone in recent sessions. Additionally, APL Apollo continues to trade comfortably above its key 20-day, 50-day, 100-day, and 200-day EMAs on the daily chart, signalling strong trend alignment and reinforcing the positive technical structure.
On the upside, immediate resistance is seen around the Rs 1,800 mark, and a decisive breakout with sustained price action above this level could open the door for further upside in the near term. The RSI stands at 68.77 and is trending higher, indicating strengthening momentum while remaining below extreme overbought levels.
Strategy: Buy
Target: Rs 1,950
Stop-Loss: Rs 1,710
Disclaimer: The views and investment tips expressed by experts on Moneycontrol are their own and not those of the website or its management. Moneycontrol advises users to check with certified experts before taking any investment decisions.Discover the latest Business News, Sensex, and Nifty updates. Obtain Personal Finance insights, tax queries, and expert opinions on Moneycontrol or download the Moneycontrol App to stay updated!
Find the best of Al News in one place, specially curated for you every weekend.
Stay on top of the latest tech trends and biggest startup news.


