We have seen a smart rebound on July 6, the weekly F&O expiry session, as the benchmark indices hit fresh all-time highs with the Nifty50 climbing 19,500 for the first time, backed by oil & gas, auto, and select banks stocks. The broader markets continued to outperform frontline indices.
The BSE Sensex jumped 340 points to end at a record closing high of 65,786, and the Nifty50 sees a fresh closing high of 19,497, rising nearly 100 points, while the Nifty Midcap 100 and Smallcap 100 indices gained 1 percent and 0.8 percent respectively.
The Bank Nifty maintained 45,000 mark fourth straight session, soaring 188 points to 45,340, while the Nifty IT index corrected 37 points to 29,805.
Stocks that were strong in action included Apollo Hospitals Enterprises, HPCL, and Mahindra and Mahindra. Apollo Hospitals Enterprises rallied 4 percent to Rs 5,283, the highest closing level since December 8, 2021, and formed robust bullish candlestick pattern on the daily charts with strong volumes after a consolidation breakout. The stock has also seen a breakout of long downward sloping resistance trendline adjoining highs of November 26, 2021 (record high), and June 16, 2023 (previous swing high).
HPCL has formed strong bullish candlestick pattern on the daily charts with robust volumes and closed with 4 percent gains at Rs 302. After a golden crossover with 50-day EMA crossing 200-day EMA in May, the stock stayed above 50-day EMA. The stock has given a breakout of downward sloping resistance trendline adjoining highs of November 15, 2021 and July 3, 2023.
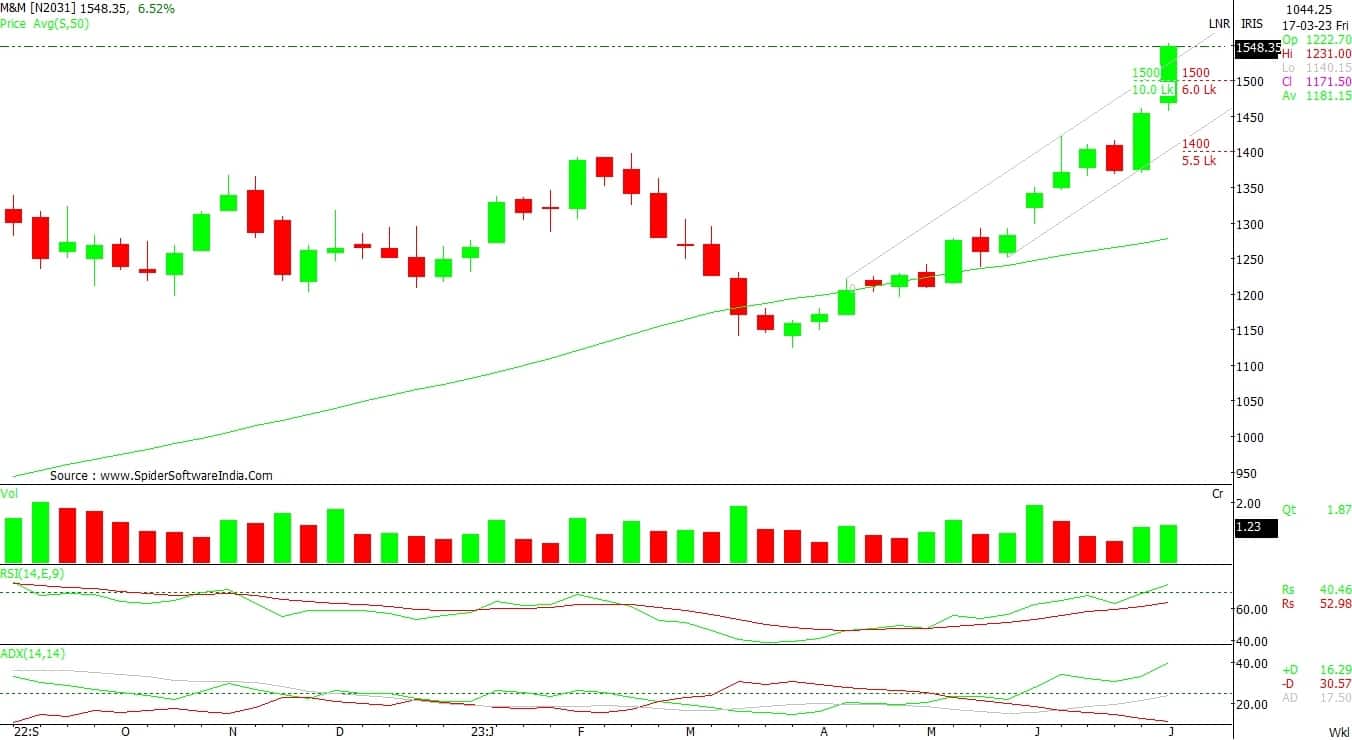
Mahindra and Mahindra hit a record high and formed healthy bullish candlestick pattern on the daily scale with strong volumes after a consolidation breakout. The stock jumped 5 percent to Rs 1,549, while the stock surged 38 percent from March lows.
Here's what Shrikant Chouhan of Kotak Securities recommends investors should do with these stocks when the market resumes trading today:
Hindustan Petroleum Corporation (HPCL)
The stock has given a breakout of its Ascending Triangle chart pattern with a strong bullish candlestick on the weekly scale. Additionally, it has formed a higher bottom formation on the daily charts, hence the structure of the counter indicates the beginning of a new up move from the current levels.
For positional traders, Rs 290 would be the trend decider level. Trading above the same uptrend formation will continue till Rs 325. However, if it closes below Rs 290, traders may prefer to exit from trading long positions.

The stock is trading into a rising channel pattern after reversal from the lower levels and forming the higher lows series continuously on the weekly scale. The strong bullish momentum suggests that the counter is likely to maintain bullish continuation chart formation in the coming horizon.
For traders, Rs 1,490 would act as an important support zone while Rs 1,660 could be the key resistance area for the short-term traders. However, below Rs 1,490 level the uptrend would be vulnerable.
Post remarkable up move of the last few weeks, the stock was in a rangebound mode. The consolidation structure of the chart formation indicated at the bullish continuation pattern. Therefore the fresh strong breakout move of the stock suggest at uptrend to persist in the near term.
For the traders, Rs 5,090 would be the key support level to watch out. Above which the uptrend structure will continue until Rs 5,650.
Disclaimer: The views and investment tips expressed by investment experts on Moneycontrol.com are their own and not those of the website or its management. Moneycontrol.com advises users to check with certified experts before taking any investment decisions.
Discover the latest Business News, Sensex, and Nifty updates. Obtain Personal Finance insights, tax queries, and expert opinions on Moneycontrol or download the Moneycontrol App to stay updated!
Find the best of Al News in one place, specially curated for you every weekend.
Stay on top of the latest tech trends and biggest startup news.