


Markets rejoiced yesterday with Nifty reclaiming the 20000 mark. Bulls were in complete dominance and drove the index above 20100 zones.
On the other hand, Bank Nifty exhibited a notable outperformance compared to the broader market yesterday, registering a substantial gain of nearly 700 points. Bank Nifty managed to close above the upper band of its Bollinger Bands at an 8-week high. Moreover, the 14-period daily RSI surpassed the 60 mark. Today Bank Nifty opened with a gap continuing the bullish momentum.
One of the stocks in focus on the derivatives front within the Bank Nifty index is Axis Bank. On Wednesday, Axis Bank's stock broke out of the downward-sloping trendline resistance formed by connecting swing highs from September 2023.
According to Sudeep Shah, Head of Technical and Derivative Research at SBI Securities, "This breakout was confirmed by above 50-day average volume. In addition, the stock has formed a sizable bullish candle on the breakout day, adding strength to the breakout."
At 9:15 am today, November 30, Axis Bank's stock also opened 0.4 percent higher at Rs 1062.50.
Outperformance Compared to Bank Nifty
Axis Bank stock marked a fresh all-time high on Wednesday, while the banking benchmark index, Bank Nifty, is trading nearly 4 percent below its all-time high. "This clearly shows outperformance compared to Bank Nifty. The relative strength comparison chart with Bank Nifty has reached new heights," stated Shah.
Momentum Indicators
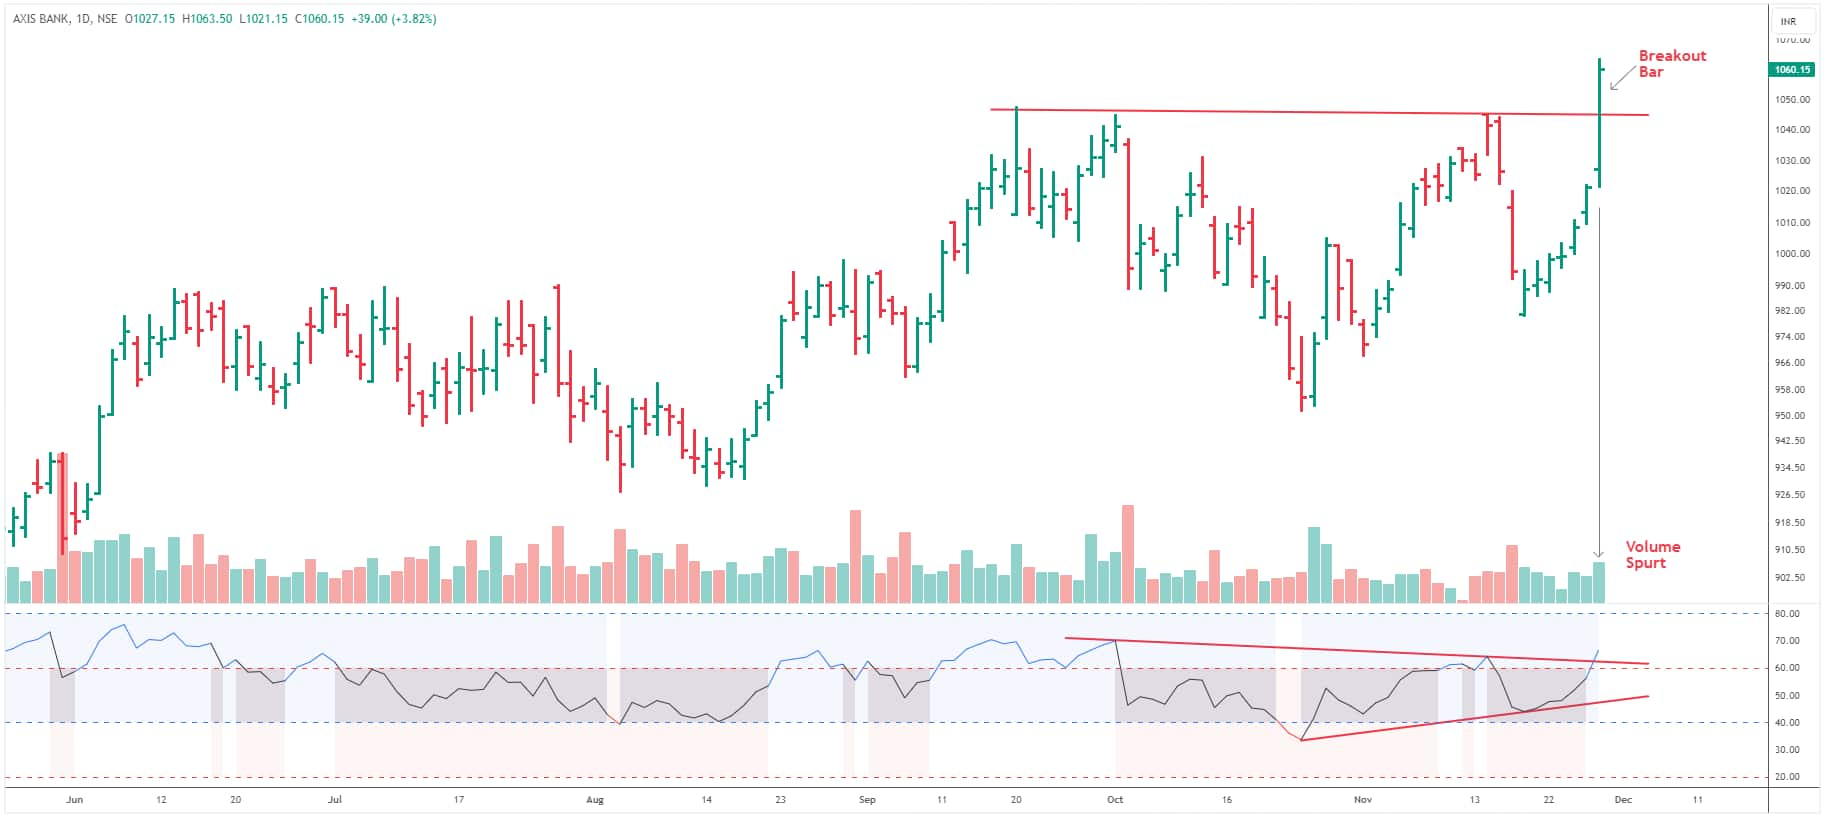
Shah highlights that the daily RSI has given a Symmetrical Triangle breakout on the daily scale, indicating an uptick in upside momentum. The daily stochastic oscillator suggests bullish strength as well, with the Percentage K above Percentage D. The signal line of Moving Average Convergence Divergence (MACD) has crossed the zero line, and the histogram has turned bullish.
Derivative Data
On the derivative front, the November series future has surged by 3.61 percent. The cumulative Open Interest (OI) of the current, next, and far series has surged by 1.16 percent, indicating a clear long build-up. Regarding the option chain, from 1130 to 940 Call (CE) strikes have either witnessed call buying or call short covering. On the put side, from 1080 to 960 Put (PE) strikes have either witnessed put writing or put long covering, clearly indicating bullish momentum in the stock. The November monthly OI Put-Call Ratio (PCR) is at 0.93, and max pain is at the 1000 strike.
Buy Axis Bank: SBI Securities Recommendation
According to Shah, these technical and derivative factors align in favor of bulls. Hence, he recommends accumulating the stock in the zone of Rs 1060-1050 with a stop loss of Rs 1025. On the upside, it is likely to test the level of Rs 1100, followed by Rs 1120 in the short term.
Discover the latest Business News, Sensex, and Nifty updates. Obtain Personal Finance insights, tax queries, and expert opinions on Moneycontrol or download the Moneycontrol App to stay updated!
Find the best of Al News in one place, specially curated for you every weekend.
Stay on top of the latest tech trends and biggest startup news.


