

The age-old Indian tradition of dhyaan or meditation is a process where you eliminate ― one by one ― the stream of jumbled thoughts in your mind to achieve a state of tranquillity. The result, if done successfully, is peace of mind, a mind that is without any stress.
Vijay Thakkar (@vijaythk), a Mumbai-based trader, has devised a trading strategy that is similar in nature. It also employs uncluttering your trading screen ― eliminating all technical indicators that you are used to ― so that you see what is hidden behind and are perhaps the most important indicators: price and volume.
He believes price along with volume is the best indicator that can guide one to make successful trades and insists on following just these instead of cluttering the trading screen with a host of indicators.
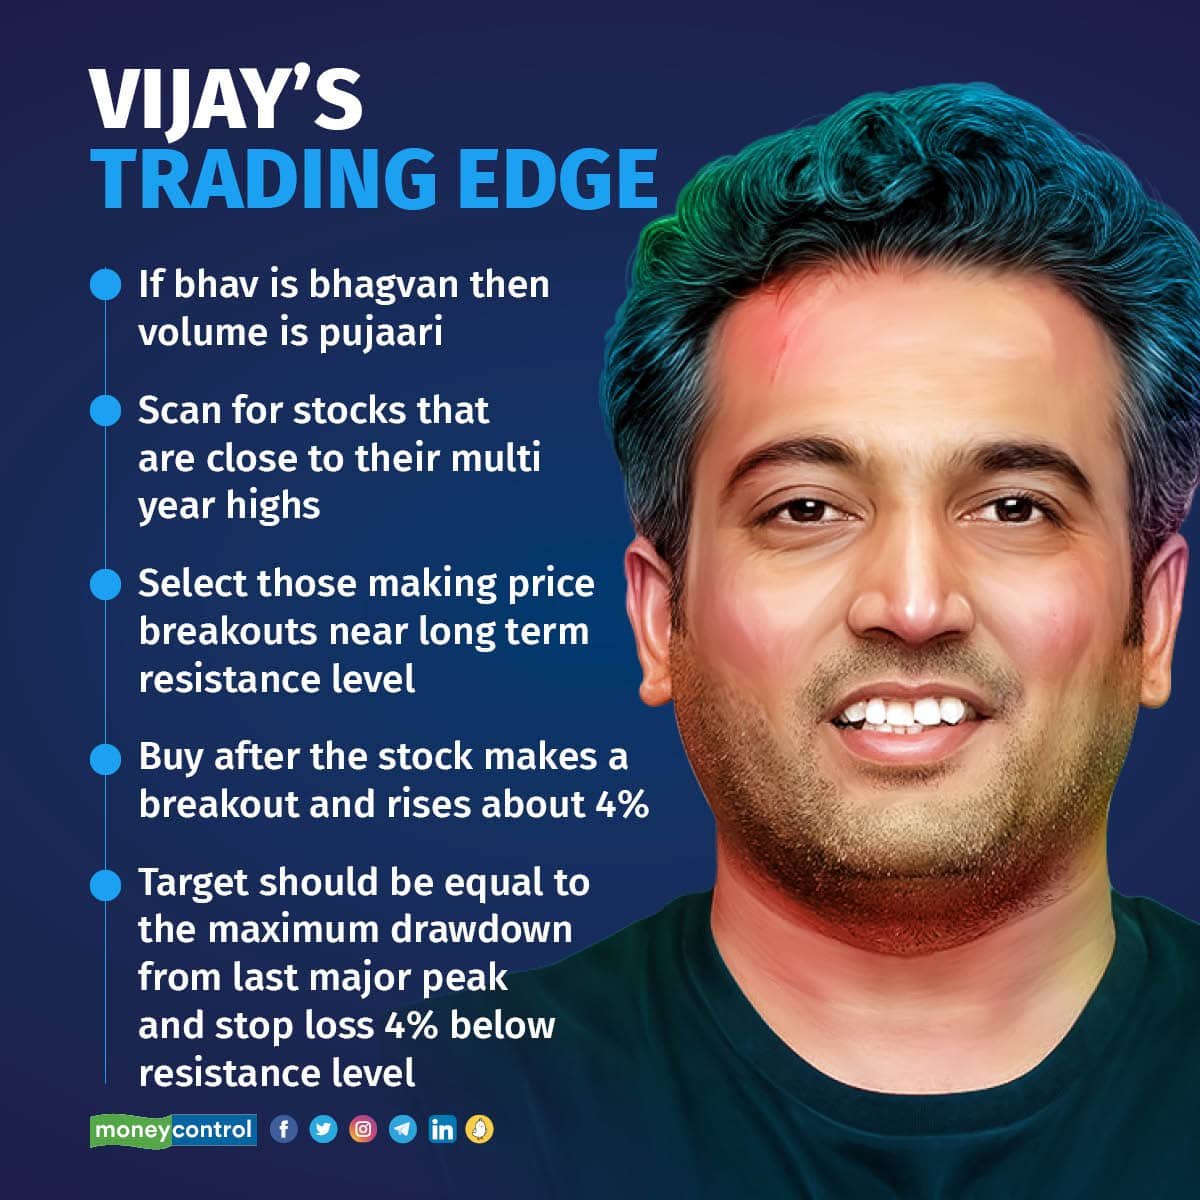
"If bhav is bhagvan, then volume is pujaari (if price is god, then volume is the priest)," Thakkar says, taking on the famous Gujarati stock market adage bhav bhagvan che.
The clarity of thought, though, did not come in a day. It might not have required a deep meditation, but it has certainly come after a fair share of struggles, mistakes and the usual toil.
Rags to riches
Thakkar today is a successful trader. He also coaches his followers on social media and YouTube to make it big in the stock market.
For countless young graduates in India, searching for their first job is usually fraught with challenges. Thakkar's story is not much different. Starting from cleaning glasses in a saree shop in Andheri, he found his first break ― and which also introduced him to the world of stock markets ― in 2008, when Motilal Oswal Financial Services hired him as a salesman. Though he could not hold on to that job for long as the market was difficult, the foundation was laid.
The loss of the job also served as an opportunity as he started working on his own as a sub-broker bringing clients to brokers. Meanwhile, he also started trading. Initially, the 35-year old says, he followed what others said. If someone suggested using Relative Strength Index (RSI), he would do that. If someone suggested Bollinger Bands, he would do that. The result was as mixed as his approach to trading.
After about three years of meeting with little success, a mistake, or rather a stroke of luck, brought him to a realisation that would change everything for him. One day, while staring at a chart on his screen some tech glitch removed all applied indicators from it. It was then that Thakkar suddenly realised he could see the price movement clearer. It was then that the strategy he uses was born. It took some time to refine the strategy, but he has never looked back since then.
Perhaps the best reward for him is the fact that he now lives in a flat in a high-rise building in front of the saree shop he worked in the past.
Trade set-up
The trade set-up Thakkar uses is a simple one that utilises long-term price movements on the candlestick chart to find the entry and exit points. The basic idea is to ride the momentum. The strategy takes just a couple of hours every week, and hence, can be employed easily even by working professionals. The set-up that Thakkar advises is follows:
Step 1: Every week scan for stocks that have hit 52-week high levels. Conservative traders can further filter it down to NSE 500 stocks only. Alternatively, you can also follow this filter that Thakkar has formulated.
Step 2: Start loading either weekly or monthly candlestick charts for stocks that the filter throws up.
Step 3: Find the last major supply zone. This will be seen in the form of a major peak on the chart. You may have to move a few years back on the chart timeline to find such a peak. Such peaks usually form major resistance zone for a stock. Draw a line at this peak.
Step 4: See if the price has reverted to the resistance zone after falling from the last supply zone. If yes, that is your viable trading candidate. If not, search for another stock.
Step 5: Once you have selected the stock, wait for its crossover of the resistance zone. The breakout candle should be strong, with relatively higher volume, which signals demand. Once there is a breakout, buy the stock within 4 percent distance from the resistance level. For instance, if resistance is placed at Rs 100, your buy price should be Rs 104. You could also place a Good Till Triggered (GTT) order at this price if you don't track the market daily.
Step 6: Find out what was the maximum drop in price since the last major supply zone was hit. Calculate the percentage and place the target at an equal percentage above the resistance zone. For instance, if a stock fell from the resistance zone of Rs 100 to Rs 60, meaning a 40 percent fall, your target will be Rs 140.
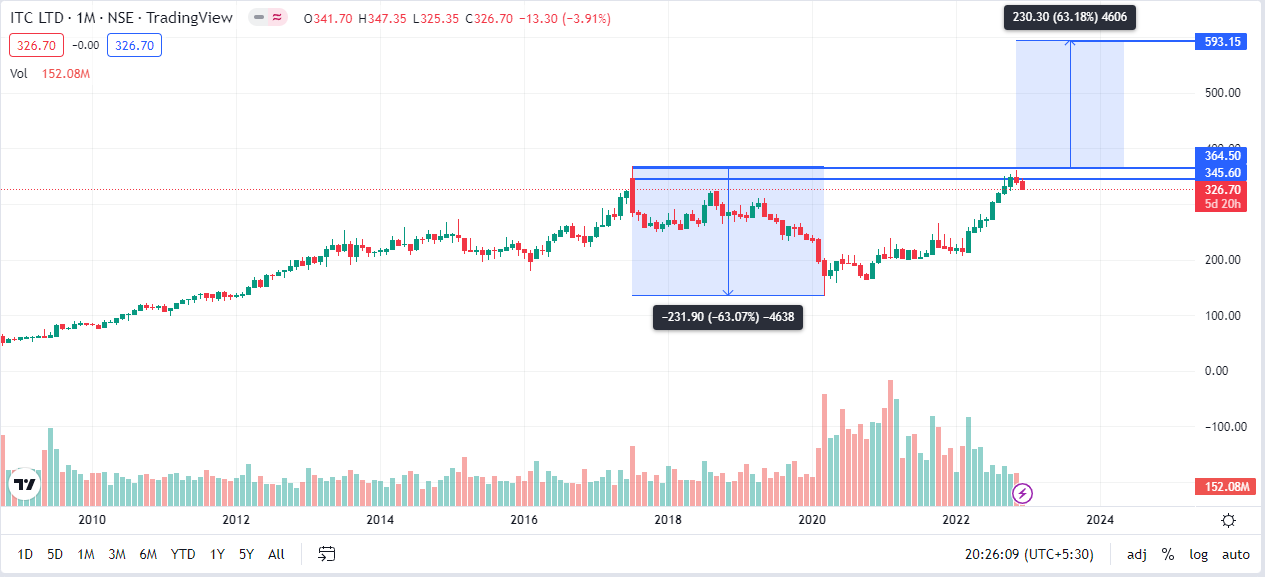 The chart shows target and resistance zone for ITC, which is hovering near its resistance zone. Usually, the price breakout after a consolidation is stronger than without consolidation, says Thakkar. Please note that this is only for illustrative purposes and not a recommendation to buy the stock of ITC either now or after a breakout. Please consult a financial advisor before taking any trades. Chart source: TradingView
Step 7: Place a stop loss 4 percent below the resistance level. In the above example, it should be Rs 96. Again, you can place a GTT sell order as the stop loss.
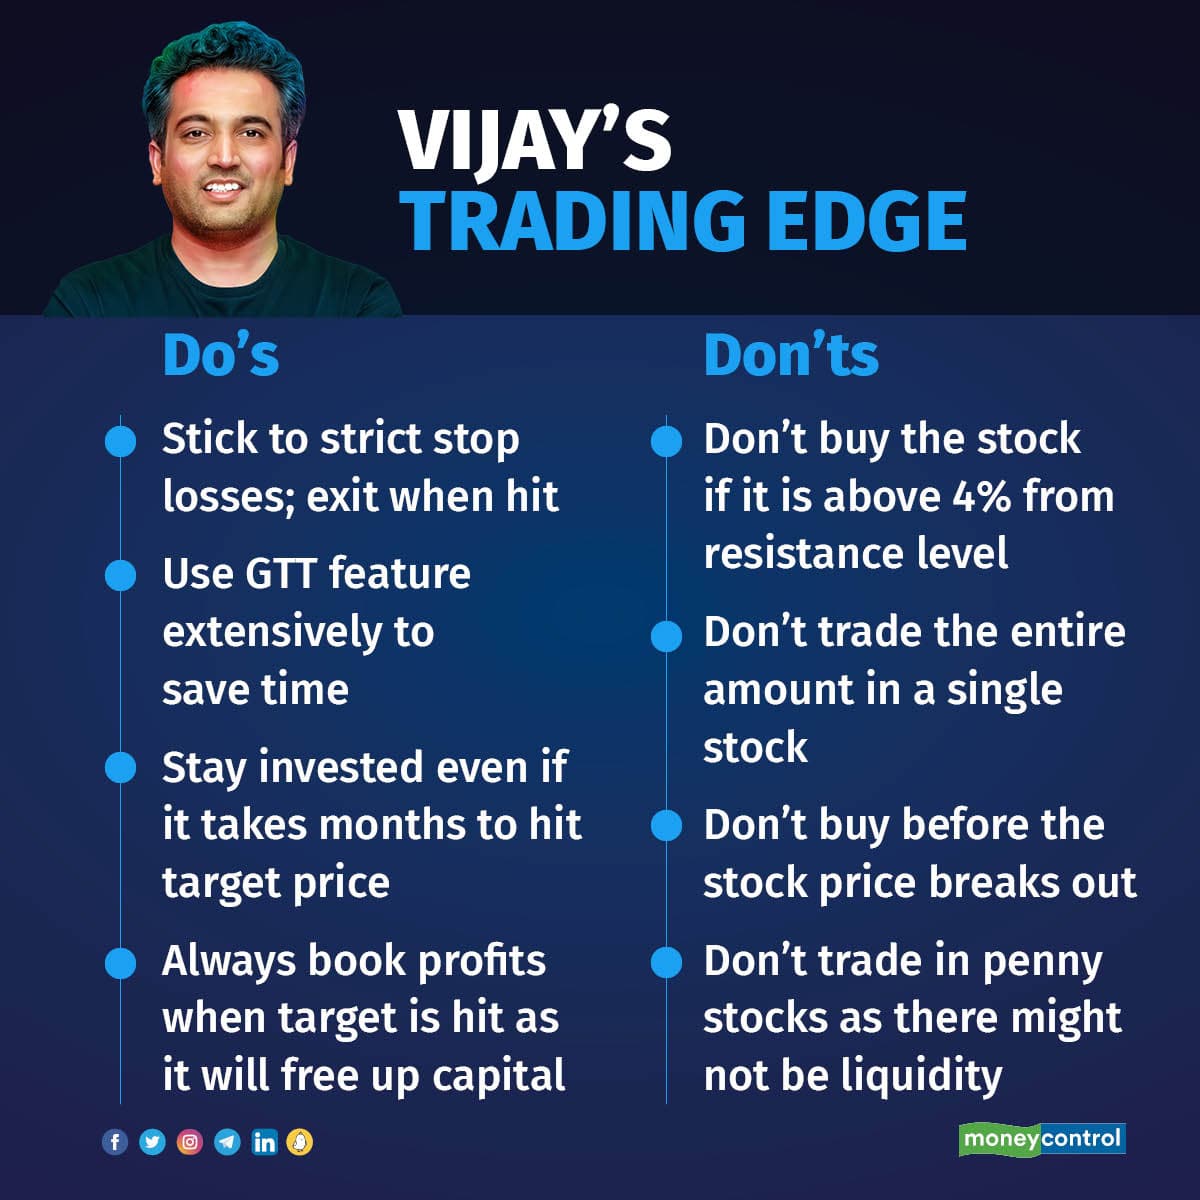
Step 8: Ride the momentum until the target is hit. Book profit on half of your holdings. Now, add the Supertrend indicator to your chart to trail your stop loss and stick with the investment. The level on Supertrend will be your new stop loss. The idea here is to not miss out on a rally if the stock continues to go higher even from the first target. Exit the entire holdings once the price hits the Supertrend indicator.
Risk management
The above set-up shows that Thakkar is not willing to lose more than Rs 8 on a trade that costs Rs 104. Thus, his risk tolerance level is around 8 percent per trade. The reward is usually five to eight times, he says. Thakkar claims he is able to generate 25-30 percent a year following his strategy.
The strategy does not require much time to follow, but Thakkar said one should be disciplined in the approach. If the stop loss is hit, then the trader should exit the trade, admitting the mistake.
The strategy can be followed by people with low amount capital as well. In the early stages, Thakkar advises to keep allocation to one stock at 10 percent of available capital. You can increase the allocation after you attain more experience in identifying the right stocks to trade.
Disclaimer: The views and investment tips expressed by investment experts on Moneycontrol.com are their own and not those of the website or its management. Moneycontrol.com advises users to check with certified experts before taking any investment decisions.
Discover the latest Business News, Sensex, and Nifty updates. Obtain Personal Finance insights, tax queries, and expert opinions on Moneycontrol or download the Moneycontrol App to stay updated!
Find the best of Al News in one place, specially curated for you every weekend.
Stay on top of the latest tech trends and biggest startup news.


