


The market registered a 1.7 percent gain on August 16 after a period of consolidation. Market breadth also turned positive, with approximately 1,624 shares advancing against 737 declining shares on the NSE. Experts expect the Nifty 50 to continue its upward journey towards the 24,700-24,800 zone, though some consolidation is likely. Above this range, the level to watch is 25,000, while on the downside, 24,300-24,200 is the key support area. Here are some trading ideas for the near term:
Vinay Rajani, CMT, Senior Technical and Derivative Analyst, at HDFC Securities
Affle India | CMP: Rs 1,554.5

Affle India has broken out from a long-term consolidation on the monthly chart, surpassing the crucial resistance of Rs 1,500 and sustaining above it. The primary trend of the stock is bullish, as it is positioned above all important moving averages.
Strategy: Buy
Target: Rs 2,050
Stop-Loss: Rs 1,365
CCL Products | CMP: Rs 683.65

CCL Products has broken out from a downward-sloping trendline on the weekly chart, closing at its highest level since July 14, 2023. It has formed a rounding bottom pattern on the weekly chart, with indicators and oscillators turning bullish on both weekly and monthly charts.
Strategy: Buy
Target: Rs 780
Stop-Loss: 600
Zensar Technologies | CMP: Rs 797.6

Zensar Technologies has broken out from a symmetrical triangle pattern on the weekly chart, with the price rise accompanied by a surge in volumes. The primary trend is bullish, with the stock forming higher tops and higher bottoms on both the weekly and daily charts. The IT sector appears to have reversed its trend from bearish to bullish
Strategy: Buy
Target: Rs 930
Stop-Loss: Rs 697
Rajesh Palviya, Senior Vice President Research (Head Technical Derivatives) at Axis Securities
Firstsource Solutions | CMP: Rs 307.7
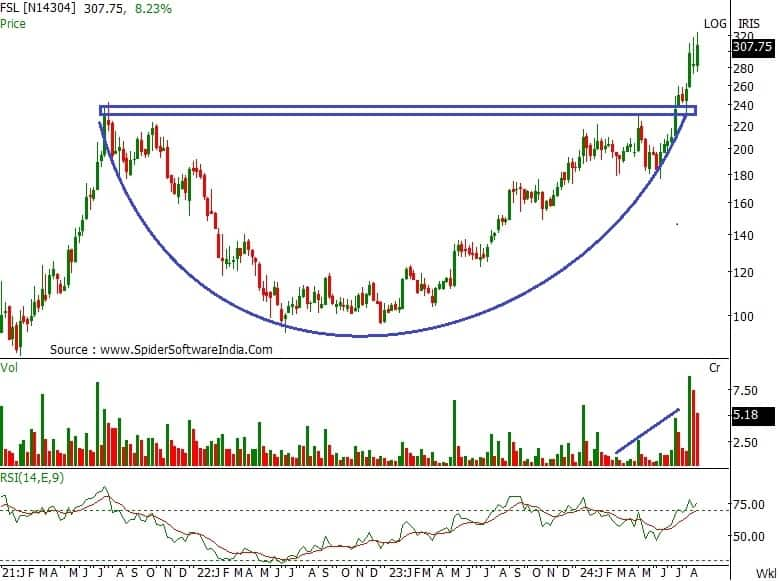
Firstsource Solutions registered an all-time high of Rs 325, reflecting bullish sentiment. During the week, it recaptured the 20-day SMA support around Rs 273 and rebounded sharply. On the weekly chart, it confirmed a "Rounding Bottom" formation on July 26, sustaining above this level, which indicates a positive bias. The stock is positioned above its 20, 50, 100, and 200-day SMAs, with rising volumes at the breakout zone of Rs 260 signifying increased participation. The daily, weekly, and monthly RSI indicators are in positive territory, supporting rising strength across all time frames. Investors are advised to buy, hold, and accumulate this stock, with an expected upside of Rs 330-355 and downside support between Rs 295-275.
Strategy: Buy
Target: Rs 330, Rs 355
Stop-Loss: Rs 295
V-Guard Industries | CMP: Rs 524

V-Guard Industries is in a strong uptrend across all time frames, forming a series of higher tops and bottoms, indicating a positive bias. It is positioned above its 20, 50, 100, and 200-day SMAs, with these averages inching up along with the price rise, reaffirming the bullish trend. The RSI indicators on daily, weekly, and monthly charts are in positive terrain, indicating rising strength across all time frames. The stock confirmed a 5-6 week "consolidation range" breakout at Rs 488 levels on a closing basis. The huge volumes on this breakout indicate increased participation. Investors should buy, hold, and accumulate this stock, with an expected upside of Rs 585-630 and downside support between Rs 485-470.
Strategy: Buy
Target: Rs 585, Rs 630
Stop-Loss: Rs 485
DLF | CMP: Rs 866.9

Since January 2024, DLF has strongly consolidated within the Rs 930-750 range, with significant volumes. This consolidation zone is backed by 200-day SMA support at Rs 798, which remains a crucial support area. The stock is poised for a "down-sloping channel" breakout at Rs 895. A decisive breakout above Rs 895-900 could trigger upward momentum. The daily and weekly RSI indicators are in positive terrain, indicating rising strength across all time frames. Investors should buy, hold, and accumulate this stock, with an expected upside of Rs 960-1000 and downside support between Rs 830-800.
Strategy: Buy
Target: Rs 960, Rs 1,000
Stop-Loss: Rs 830
Rajesh Bhosale, Technical Analyst at Angel One
BSE | CMP: Rs 2,645.95

Last week, stocks related to trading platforms and exchanges were in the spotlight, and BSE demonstrated technical signs of emerging from its recent period of inactivity, with potential to outperform in the near term. On the daily chart, the stock confirmed a bullish ‘Inverse Head and Shoulders’ breakout, supported by a significant increase in volume and favourable indicator placement. Additionally, the stock experienced a bullish gap, with dips toward this level being bought up, aligning with key moving averages. It is recommended to buy BSE around Rs 2,645 - 2,640.
Strategy: Buy
Target: Rs 2,850
Stop-Loss: Rs 2,540
Coromandel International | CMP: Rs 1,759.75
Despite recent market weakness, Coromandel International remained resilient and continued to outperform. On the daily chart, prices are now trading in new territory after breaking out of a recent congestion zone. Prices have shown more significant rises during uptrends than during downtrends, indicating strong interest from committed investors. The oscillators are positively aligned, further supporting the buy signal. It is recommended to buy Coromandel around Rs 1,760 - Rs 1,755.
Strategy: Buy
Target: Rs 1,870
Stop-Loss: Rs 1,690
Polyplex Corporation | CMP: Rs 1,294

On the weekly chart, Polyplex Corporation confirmed a classic ‘Rounding Saucer’ pattern breakout, characterized by sharp vertical upmoves in the latter half of the pattern. The volume structure aligns well with the pattern's requirements; it was initially lower but has increased significantly in the second half. Prices have closed above the 89-week EMA, which previously served as resistance and now acts as support. On Friday, a strong buying gap with increased volume further bolstered positive momentum. It is recommended to buy Polyplex Corporation around Rs 1,295 - Rs 1,290.
Strategy: Buy
Target: Rs 1,455
Stop-Loss: Rs 1,220
Jigar S Patel, Senior Manager - Equity Research at Anand Rathi
Macrotech Developers (Lodha) | CMP: Rs 1,296

After reaching a high near Rs 1,595, Lodha has undergone a substantial decline, shedding 28 percent of its gains. This significant correction has brought the stock down to a critical technical level, where it has found support at the 200-day DEMA. The 200 DEMA is a widely recognized indicator used by traders to identify long-term support levels, and in this case, it appears to be playing a crucial role in stabilizing the stock.
Adding to the significance of this support level, a bullish BAT pattern has emerged right at the 200 DEMA, further strengthening the case for a potential reversal in the stock's downtrend. The bullish BAT pattern, a harmonic trading pattern known for its reliability in signaling potential price reversals, suggests that the stock may be poised for a recovery. Given these technical signals, it is recommended to consider taking a long position in Lodha within the price range of Rs 1,275-1,300. The potential upside target is set at Rs 1,400, providing a favourable risk-reward ratio. To manage risk, a stop-loss should be placed at Rs 1,232 on a daily closing basis, ensuring that any further downside movement is contained.
Strategy: Buy
Target: Rs 1,400
Stop-Loss: Rs 1,232
Disclaimer: The views and investment tips expressed by investment experts on Moneycontrol.com are their own and not those of the website or its management. Moneycontrol.com advises users to check with certified experts before taking any investment decisions.
Discover the latest Business News, Sensex, and Nifty updates. Obtain Personal Finance insights, tax queries, and expert opinions on Moneycontrol or download the Moneycontrol App to stay updated!
Find the best of Al News in one place, specially curated for you every weekend.
Stay on top of the latest tech trends and biggest startup news.


