
Despite positive breadth, the market finished the volatile session in the red on July 24, after trading within the previous day's range, with the Nifty 50 holding the 24,400 mark. About 1,748 shares advanced against 596 declining shares on the NSE. Consolidation is expected to continue, with 24,400 as immediate support followed by key support at 24,100, while 24,600-24,700 is the zone to watch out for on the higher side. Here are some trading ideas for the near term:
Vidnyan S Sawant, Head of Research at GEPL Capital
NTPC | CMP: Rs 393
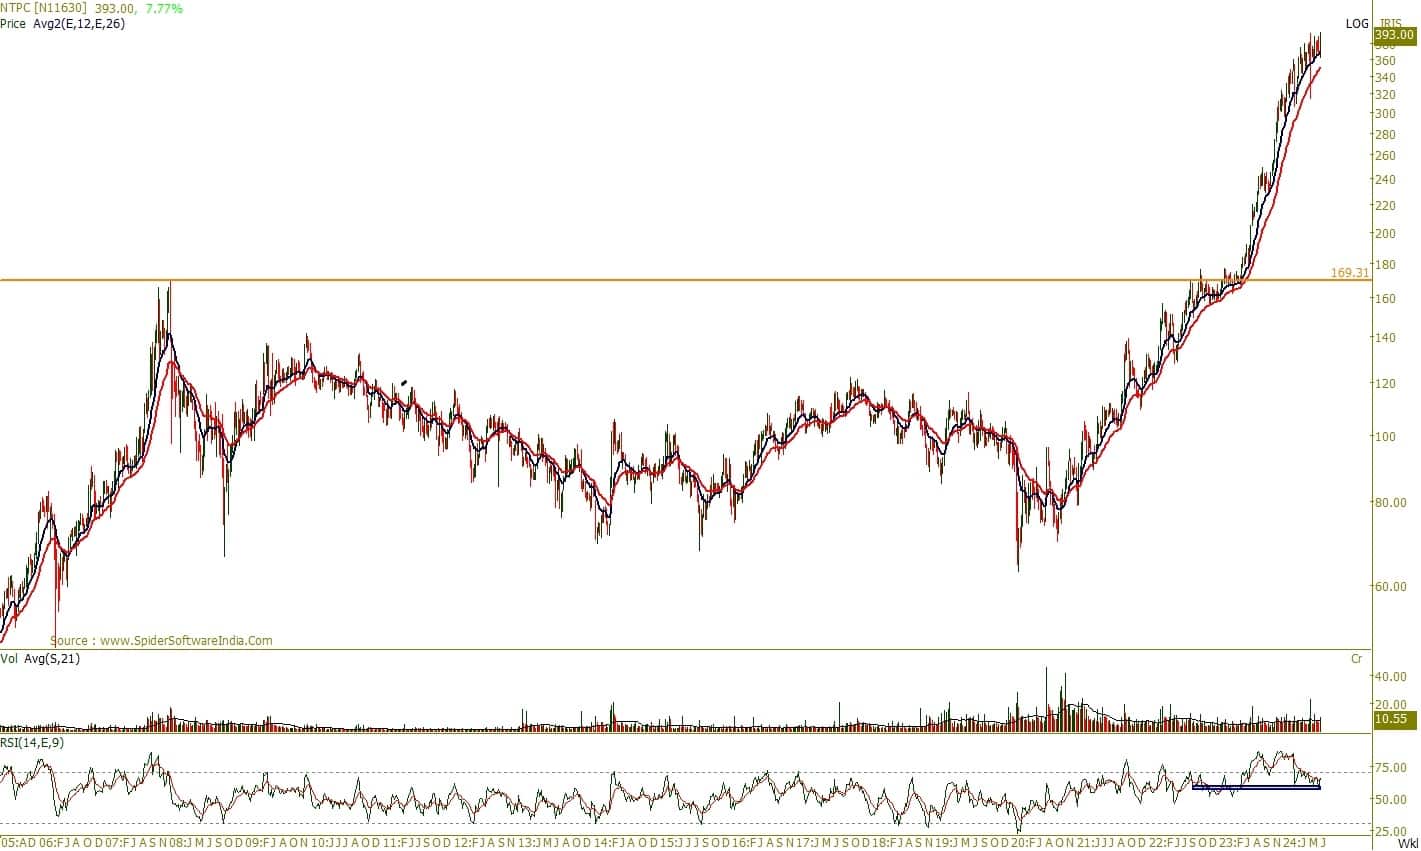
NTPC has shown clear outperformance after breaking out of its multi-year resistance from the 2018 swing high in June 2023. Before this breakout, the stock had been in an underperforming zone, consolidating within a range. Following the breakout, the stock has consistently formed higher highs and higher lows, indicating robust momentum.
During this rising trend, the stock has exhibited bullish mean reversion from minor dips, with purchases occurring around the 12-week and 26-week averages, highlighting strong price structural development. Another notable point is that the stock's RSI (Relative Strength Index) has not fallen below the 50 mark since December 2022, and the weekly RSI remains above 60, signifying a positive trend backed by bullish momentum. On the volume front, the stock has experienced substantial delivery volumes recently, indicating significant participation from large investors.
Strategy: Buy
Target: Rs 472
Stop-Loss: Rs 360
Emami | CMP: Rs 800
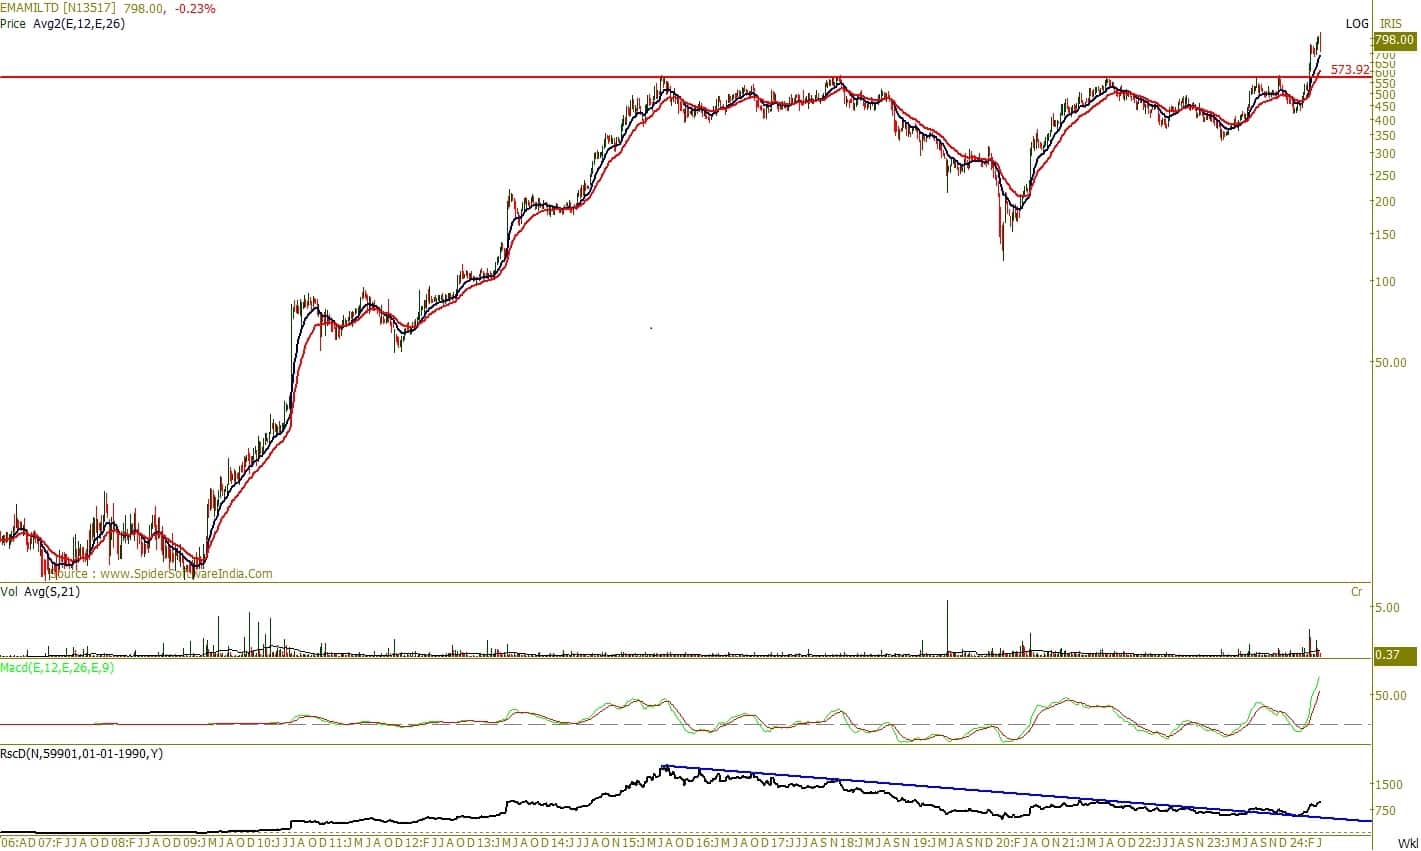
Emami has been a standout performer, exhibiting strong price development that suggests a continuation of its upward trajectory. On a monthly scale, the stock has broken through a significant resistance level established in 2015. This breakout indicates a robust bullish trend.
On a weekly scale, Emami has consistently formed higher highs, reinforcing the trend continuation. The stock is also maintaining its position above key moving averages, such as the 12-week and 26-week averages. Additionally, the momentum indicator MACD (Moving Average Convergence Divergence) is trending higher, which denotes a positive trend supported by bullish momentum.
Furthermore, on the ratio chart of Emami against Nifty, there was a notable reversal in April 2024 from a downward-sloping trend line. Since then, Emami has continued to outperform the broader market, showcasing its robust performance.
Strategy: Buy
Target: Rs 966
Stop-Loss: Rs 730
Indian Hotels Company | CMP: Rs 633

Indian Hotels has been a standout performer from 2020 to 2024, consistently trending higher within a rising channel. The stock gained further momentum after breaking out in 2022 from a rising trend line connecting the swing tops from 2006, maintaining its upward trajectory since. Indian Hotels has successfully sustained above key moving averages. The momentum indicator remains in positive territory, indicating a robust alignment of trend and momentum on the monthly scale.
The ratio chart of Indian Hotels against the Nifty reveals an interesting relative performance of the stock. It is on the verge of breaking out from the 2006 swing high, and currently, it is sustaining well, reinforcing the likelihood of continued outperformance in the future. Looking ahead, the stock appears poised for further gains.
Strategy: Buy
Target: Rs 743
Stop-Loss: Rs 584
Castrol India | CMP: Rs 270.55

Castrol India has recently picked up momentum after a long period of underperformance since 2014, showcasing robust price structural development. On the monthly scale, the stock displayed a change in polarity in June 2024 and the current month, confirming the start of a fresh upward leg.
On the weekly scale, the stock has shown resilient price stability. Notably, it has witnessed robust participation from investors, represented by the highest volume seen in the July series, further indicating the stock's readiness to outperform broader indices. The stock has also demonstrated bullish mean reversion, with every dip bouncing back from the 12-week and 34-week EMAs towards an upward trajectory. The RSI study shows a breakout from the sloping trend line and has formed a double bottom formation on the weekly scale, reinforcing the bullish momentum.
Strategy: Buy
Target: Rs 332
Stop-Loss: Rs 250
Jatin Gedia, Technical Research Analyst, Capital Market Strategy at Sharekhan by BNP Paribas
Mahindra Holidays and Resorts India | CMP: Rs 467
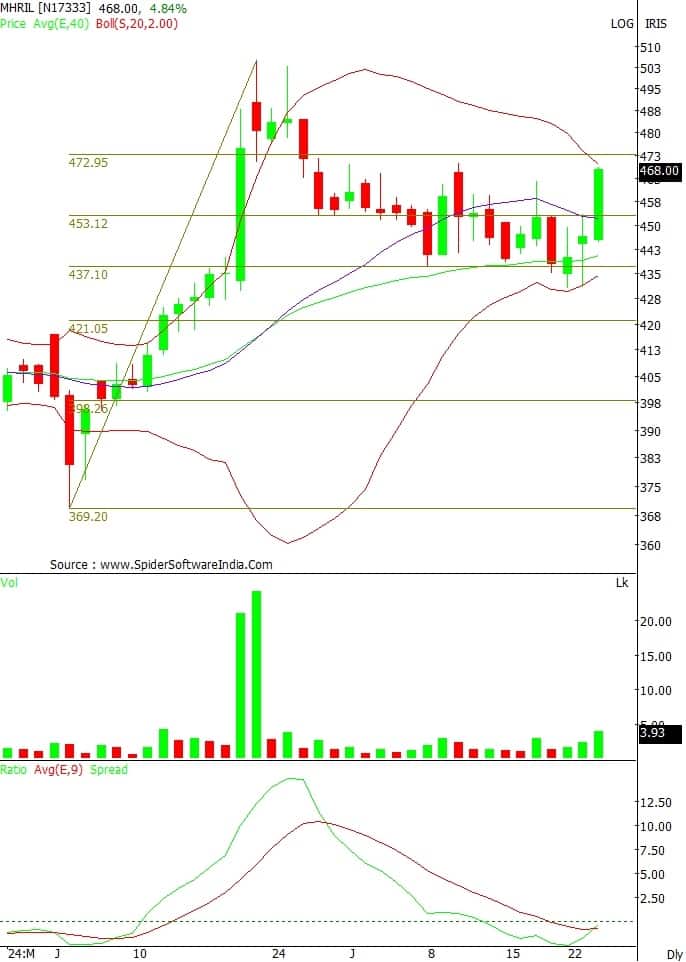
Mahindra Holidays was in a consolidation mode for the last four weeks. It has taken support at the support cluster zone of Rs 437 – 430 where support parameters in the form of the 40-day moving average and the 50 percent Fibonacci retracement levels were placed. The daily momentum indicator has triggered a fresh positive crossover, which is a buy signal. The stock has witnessed a sharp surge with above-average volume. Thus, technical parameters are suggesting a sharp rise over the next few trading sessions.
Strategy: Buy
Target: Rs 505, Rs 545
Stop-Loss: Rs 447
Crompton Greaves Consumer Electricals | CMP: Rs 443

Crompton Greaves has broken out of a sideways consolidation on the upside. The Bollinger bands are expanding and prices are moving along the upper band, suggesting that the rally is likely to continue. Above-average volume and a positive crossover on the momentum indicator support our bullish outlook on the stock.
Strategy: Buy
Target: Rs 468-484
Stop-Loss: Rs 422
Rupak De, Senior Technical Analyst at LKP Securities
Aditya Birla Fashion and Retail | CMP: Rs 322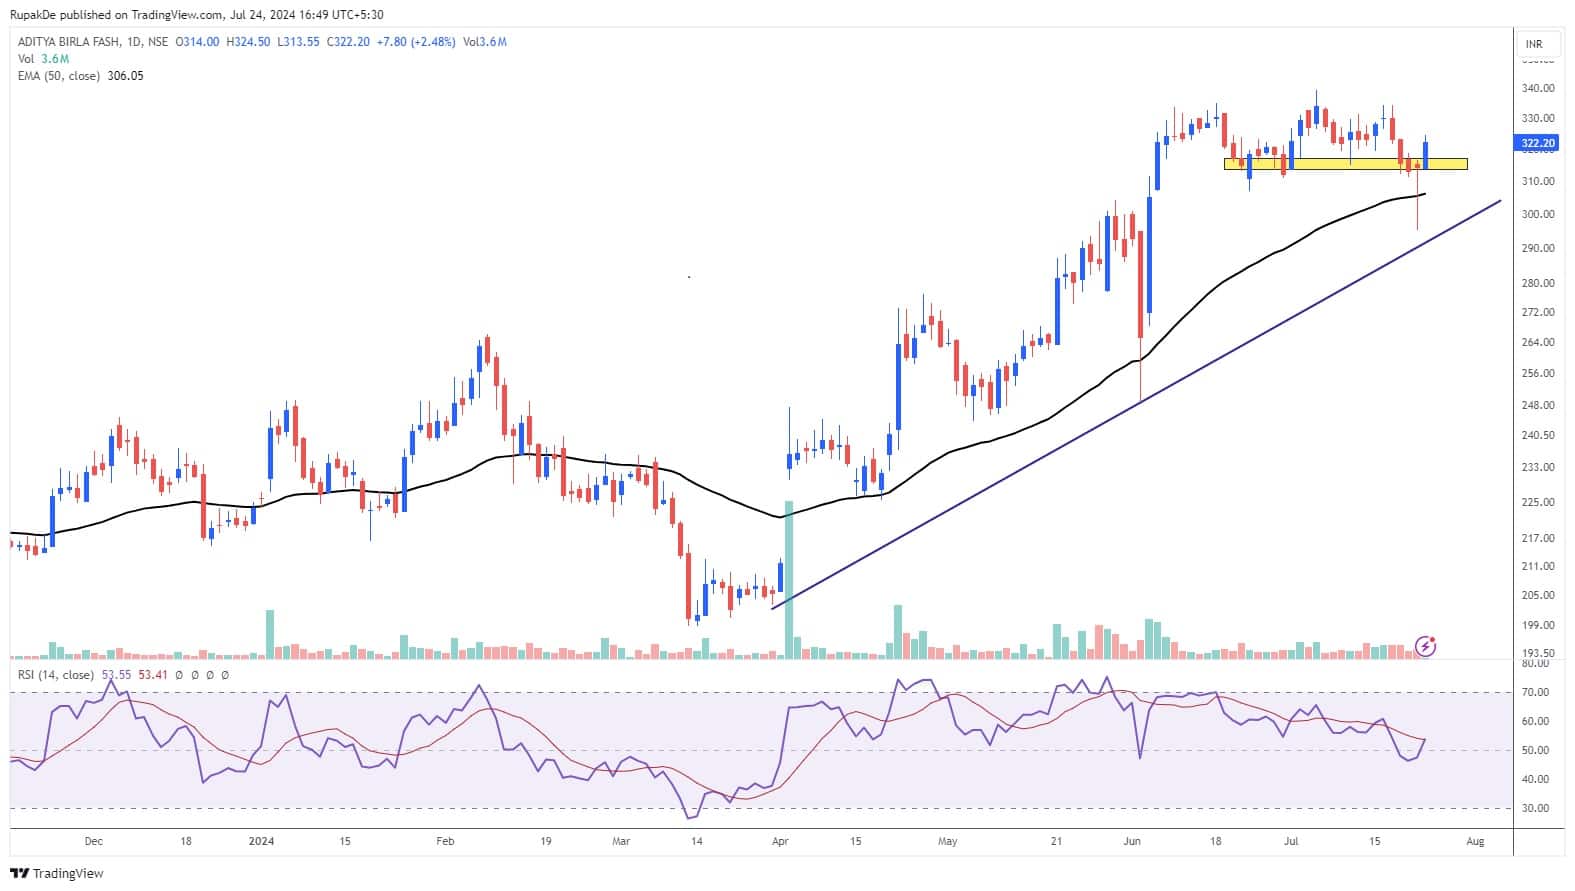
Aditya Birla Fashion has moved up smartly following a Dragonfly Doji pattern formation on the daily chart. Additionally, the stock has reclaimed the 21-day EMA. The RSI has entered a bullish crossover on the daily timeframe. In the short term, the stock might move towards Rs 340, with support on the lower end at Rs 313.
Strategy: Buy
Target: Rs 340
Stop-Loss: Rs 313
Shitij Gandhi, Senior Technical Research Analyst at SMC Global Securities
IDBI Bank | CMP: Rs 97.5
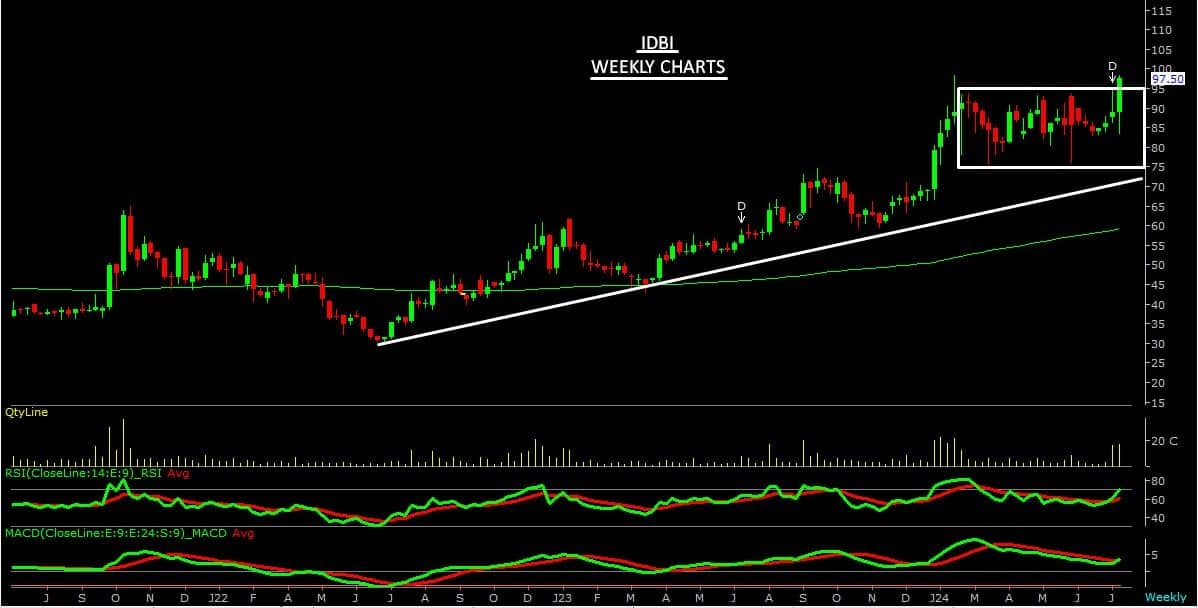
IDBI Bank has been maintaining bullish momentum for the last two years as prices have been rising with the formation of higher highs and higher bottoms on a weekly interval. On the short-term charts, the stock has been consolidating in the range of Rs 80-95 for the last four to five months. This week, a fresh breakout has been observed above the defined range after a prolonged consolidation phase. Therefore, one can buy/hold/accumulate the stock for the expected upside of Rs 118-120 levels with a support zone of Rs 95-94 levels.
Strategy: Buy
Target: Rs 118, Rs 120
Stop-Loss: Rs 85
Devyani International | CMP: Rs 181
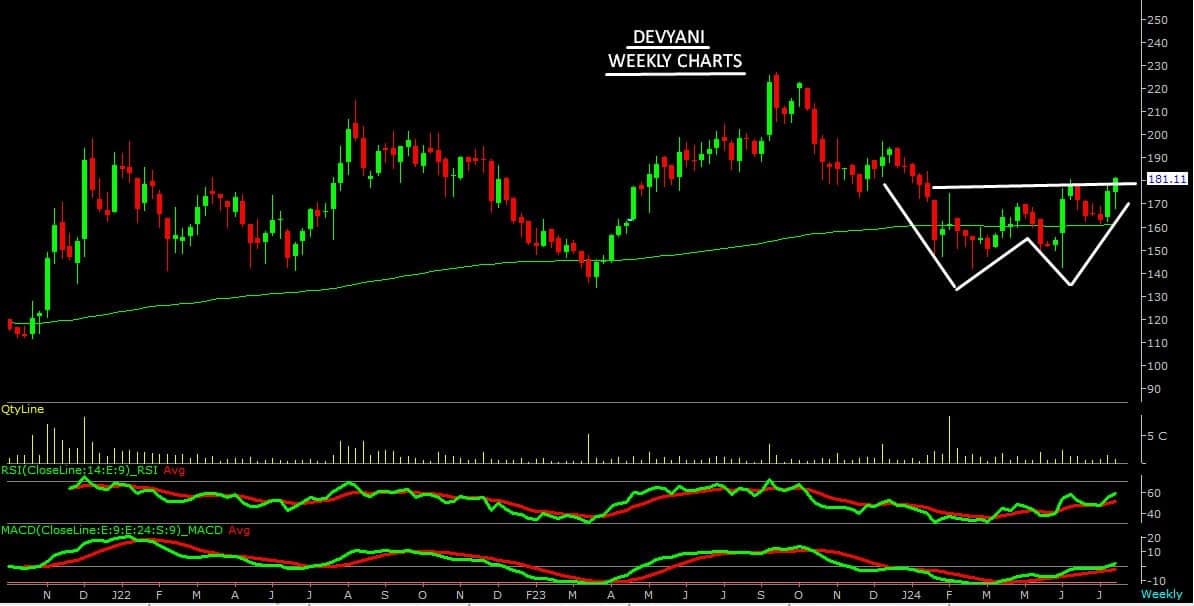
For nearly three months, Devyani has been consolidating in the broader range of Rs 145-175, with prices seen hovering around its 200-day exponential moving average on a daily interval. This week, we have observed a fresh breakout into the stock after a prolonged consolidation phase. Additionally, the stock has managed to give a breakout above the W pattern visible on the weekly interval. The price action seen is accompanied by rising volumes as well, which suggests a fresh upswing in prices in the upcoming sessions. Therefore, one can buy/hold/accumulate the stock.
Strategy: Buy
Target: Rs 205, Rs 210
Stop-Loss: Rs 165
Max Financial Services | CMP: Rs 1,094
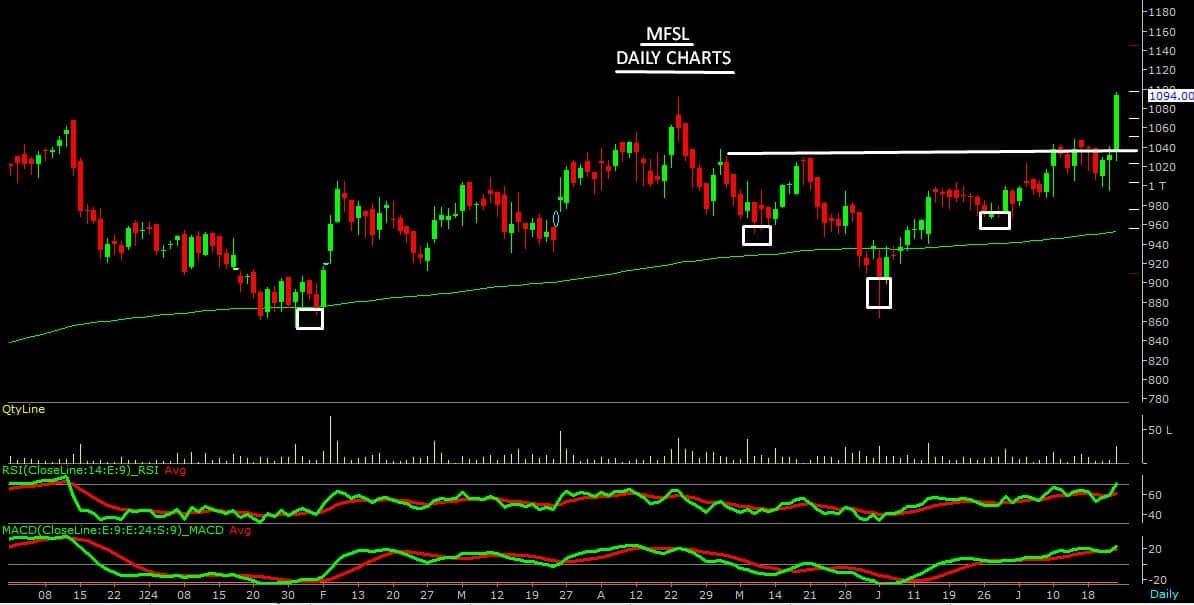
Max Financial Services has exhibited a steady recovery, with prices gradually rising from the Rs 900 level to around the Rs 1,080 level over the past few weeks. Currently, the stock has gained fresh momentum, breaking through its key resistance zone and reaching its 52-week high of Rs 1,098. This bullish momentum is likely to continue, as a fresh breakout has been observed in the stock above the Inverted Head & Shoulder pattern. Therefore, one can buy/hold/accumulate the stock.
Strategy: Buy
Target: Rs 1,250, Rs 1,260
Stop-Loss: Rs 1,000
Disclaimer: The views and investment tips expressed by investment experts on Moneycontrol.com are their own and not those of the website or its management. Moneycontrol.com advises users to check with certified experts before taking any investment decisions.
Discover the latest Business News, Sensex, and Nifty updates. Obtain Personal Finance insights, tax queries, and expert opinions on Moneycontrol or download the Moneycontrol App to stay updated!
Find the best of Al News in one place, specially curated for you every weekend.
Stay on top of the latest tech trends and biggest startup news.


