


The benchmark indices saw profit booking after hitting new highs, closing in the red on July 10, with negative breadth. About 1,640 shares declined, while 694 shares advanced on the NSE. The Nifty 50 failed to sustain 24,400 on a closing basis. If the index breaks 24,200, the immediate support, then selling pressure may extend till 24,000. On the higher side, the resistance is placed at 24,460. Here are some trading ideas for the near term:
Jatin Gedia, Technical Research Analyst, Capital Market Strategy at Sharekhan by BNP Paribas
Federal Bank | CMP: Rs 188.66

Federal Bank has been trading in an upward sloping channel. The correction found buying interest at the confluence of the 40-hour moving average and the lower Bollinger band. The momentum indicator has triggered a positive crossover from the equilibrium line, suggesting the start of a fresh cycle. We expect the stock to continue its upmove towards Rs 195 – 201 levels. One should keep a stop-loss of Rs 184 for long positions.
Strategy: Buy
Target: Rs 195, Rs 201
Stop-Loss: Rs 184
SBI Cards and Payment Services | CMP: Rs 745.3

SBI Card has witnessed buying interest from the 38.2 percent Fibonacci retracement level of the previous rise and has experienced a fresh breakout. The daily momentum indicator has triggered a fresh positive crossover, which is a buy signal. Bollinger bands have begun to expand, and prices are moving along the upper band, suggesting continuation of the positive momentum. Thus, both price and momentum indicators suggest the continuation of the upmove towards Rs 765 – 789. A stop-loss of Rs 725 should be maintained for long positions.
Strategy: Buy
Target: Rs 765, Rs 789
Stop-Loss: Rs 725
Vidnyan Sawant, HOD - Research at GEPL Capital
Deepak Nitrite | CMP: Rs 2,724.9
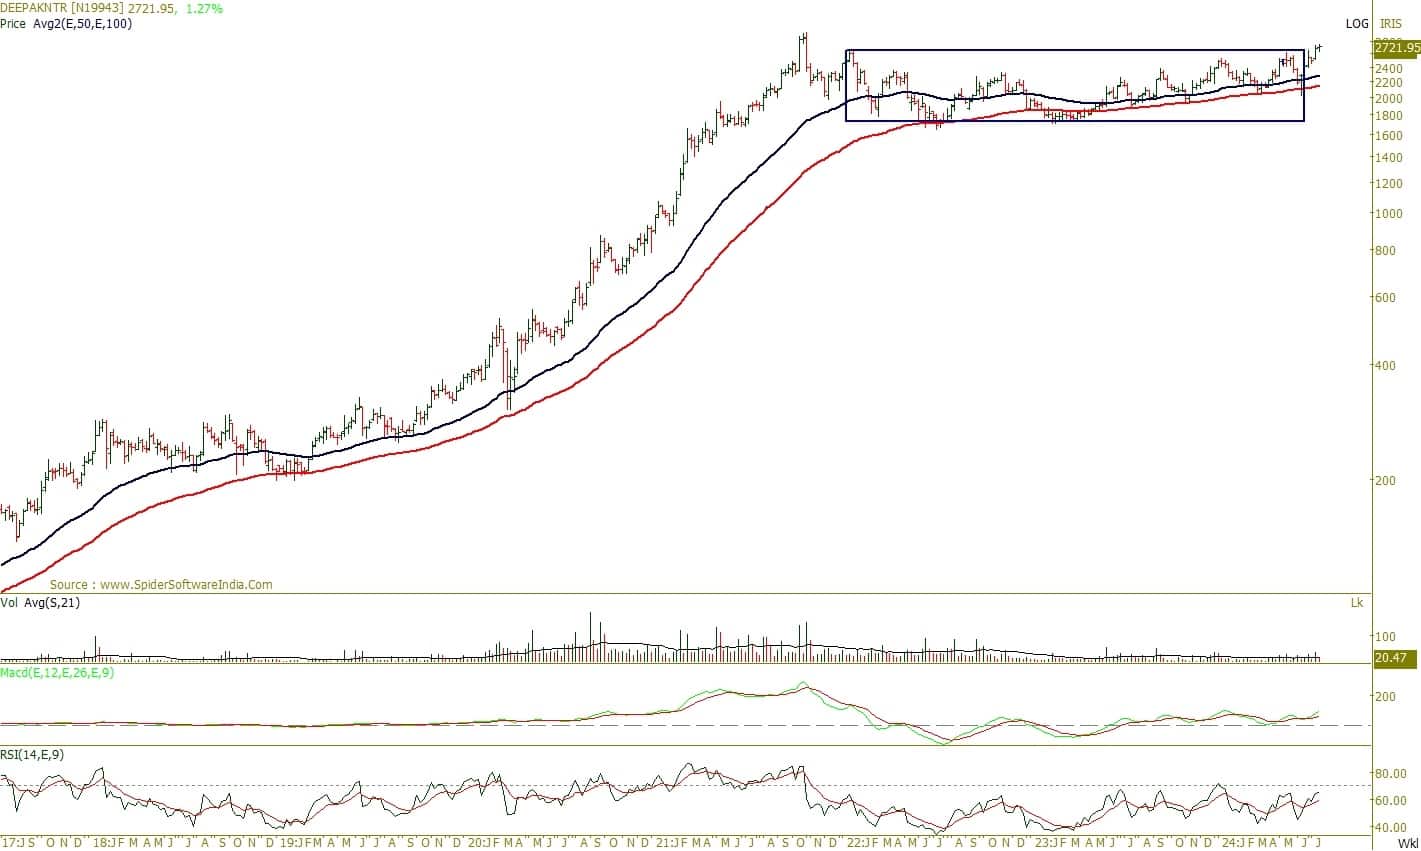
After experiencing robust momentum since 2020, Deepak Nitrite underwent a healthy retracement from 2022 to 2024, forming a significant base. The beginning of the July series witnessed a breakout from this base, indicating a structural price development for an upward trajectory. Despite broader market volatility, the stock has demonstrated high relative strength.
Notably, the stock has formed a base around the key 50-week and 100-week EMAs (Exponential Moving Average), indicating a robust trend improvement. The current week's RSI (Relative Strength Index) sustaining above 60, along with the MACD (Moving Average Convergence Divergence) in positive territory, denotes trend development supported by strong momentum. Looking ahead, there is a potential upside for the stock, with a target of Rs 3,266. It's advisable to set a stop-loss at Rs 2,505 on a closing basis to manage risks effectively.
Strategy: Buy
Target: Rs 3,266
Stop-Loss: Rs 2,505
Va Tech Wabag | CMP: Rs 1,294

Va Tech Wabag has been in a clear bullish phase since breaking out of a long sloping trendline on a quarterly closing basis in June 2023. Following this breakout, the stock has consistently formed higher highs. Recently, Va Tech Wabag exhibited another breakout on a quarterly closing basis, surpassing the multi-year swing high from 2014, spanning approximately 11 years. This suggests the stock is likely to continue its strong performance in the coming quarters. The stock has consistently sustained above the 50-week and 100-week EMA, indicating a strong upward trend. Additionally, the MACD study continues to wave in the rising trend and has also witnessed a multi-year breakout, further reinforcing the bullish sentiment. The ratio chart of Va Tech Wabag against the Nifty shows a large base breakout of 2018, indicating the stock's readiness for continued outperformance.
Strategy: Buy
Target: Rs 1,554
Stop-Loss: Rs 1,190
PG Electroplast | CMP: Rs 397

Since 2020, PG Electroplast has exhibited a robust price structure, maintaining a rising trend and forming higher highs and higher lows on the monthly scale, representing a gradual uptrend. The stock has shown strong relative strength despite broader market volatility. Notably, during this rising trend, PG Electroplast has consistently demonstrated bullish mean reversion, with every dip being bought back from the 50-week and 100-week EMAs. The consistent formation of higher highs on a weekly basis after bullish mean reversions denotes robust price development. The MACD study is trending higher in positive territory, reinforcing the trend backed by momentum. Additionally, the ratio chart of PG Electroplast against the Nifty indicates continued outperformance, with the ratio line rising higher.
Strategy: Buy
Target: Rs 495
Stop-Loss: Rs 360
Granules India | CMP: Rs 518

Analyzing Granules India stock reveals a robust price structure, with the stock typically bottoming out around a 50 percent price correction before delivering strong price growth. On the daily scale, the stock has been maintaining higher highs and higher lows and is trading above its monthly pivot at Rs 467, indicating positive price stability. Currently, Granules India is trading above key moving averages, such as the 20-week and 50-week EMAs, indicating a positive trend. Additionally, the RSI is above 60, denoting momentum in line with the trend. Furthermore, the ratio chart of Granules India against the Nifty has been trending higher after witnessing polarity from the 2015 (year) swing, indicating the stock's readiness to outperform the broader market.
Strategy: Buy
Target: Rs 633
Stop-Loss: Rs 475
Rupak De, Senior Technical Analyst at LKP Securities
Syngene International | CMP: Rs 744.6

Syngene International has given a falling trendline breakout on the daily timeframe, suggesting a rise in optimism. Additionally, the price has been moving within a giant wedge pattern and recently found support at the lower side of the wedge. The weekly RSI is in a bullish crossover and rising. In the short term, the stock might remain strong with the potential to reach Rs 800, while support is placed at Rs 728, below which the stock might fall back into consolidation.
Strategy: Buy
Target: Rs 800
Stop-Loss: Rs 728
Zydus Lifesciences | CMP: Rs 1,180

Zydus Lifesciences has given a consolidation pattern breakout on the daily timeframe, suggesting a rise in optimism. Additionally, the price has been moving within a giant wedge pattern and recently found support at the lower side of the wedge. The weekly RSI is in a bullish crossover and rising. In the short term, the stock might remain strong with the potential to reach Rs 1,270, while support is placed at Rs 1,144, below which the stock might fall back into consolidation.
Strategy: Buy
Target: Rs 1,270
Stop-Loss: Rs 1,144
Shitij Gandhi, Senior Technical Research Analyst at SMC Global Securities
Max Financial Services | CMP: Rs 1,037.75

Max Financial Services exhibits a volatile nature, characterized by recent significant fluctuations within a wide range of Rs 880 to Rs 1,080. Currently, the stock has successfully broken out above the Inverted Head and Shoulders pattern. Furthermore, on broader charts, it has formed a Double Bottom pattern, indicating a potential reversal in its price trajectory. Therefore, one can buy/hold/accumulate the stock for the expected upside of Rs 1,160-1,170 levels with a downside support zone of Rs 1,025-1,020 levels.
Strategy: Buy
Target: Rs 1,160, Rs 1,170
Stop-Loss: Rs 960
Berger Paints | CMP: Rs 526.3

Berger Paints has faced significant downward pressure since it broke below the Rs 550 mark recently. In June 2024, it hit a 52-week low of Rs 439, but since then, it has shown a strong recovery resembling a V-shaped pattern, reclaiming levels above Rs 500. Currently, there are signs of a potential reversal as the stock has recently broken out above the Inverted Head and Shoulders pattern on the daily timeframe. Therefore, one can buy/hold/accumulate the stock for the expected upside of Rs 585-590 levels with a downside support zone of Rs 520-515 levels.
Strategy: Buy
Target: Rs 585, Rs 590
Stop-Loss: Rs 480
Disclaimer: The views and investment tips expressed by experts on Moneycontrol are their own and not those of the website or its management. Moneycontrol advises users to check with certified experts before taking any investment decisions.
Discover the latest Business News, Sensex, and Nifty updates. Obtain Personal Finance insights, tax queries, and expert opinions on Moneycontrol or download the Moneycontrol App to stay updated!
Find the best of Al News in one place, specially curated for you every weekend.
Stay on top of the latest tech trends and biggest startup news.


