


The Nifty 50 reversed more than half of its recent rally during the latest correction, falling 166 points and extending its weakness for the fifth straight day on September 25. Technical and momentum indicators suggest further downside in the market, as the index slipped below the crucial support level of 24,900. As long as the index remains below this level, bears may continue to hold the upper hand and drag the index toward the 24,600–24,500 zone. However, in the event of a rebound, the 25,000–25,100 range is expected to act as an immediate hurdle, according to experts.
Here are 15 data points we have collated to help you spot profitable trades:
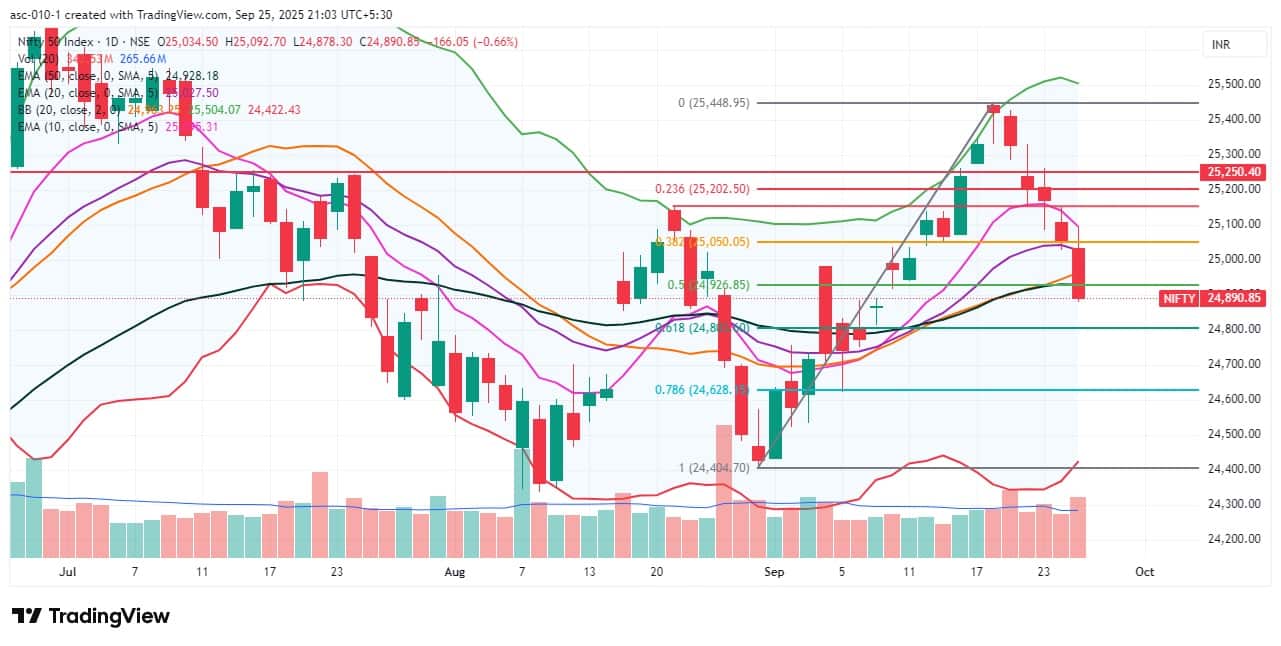
1) Key Levels For The Nifty 50 (24,891)
Resistance based on pivot points: 25,036, 25,086, and 25,168
Support based on pivot points: 24,872, 24,821, and 24,740
Special Formation: The Nifty 50 formed a long bearish candle with an upper shadow on the daily timeframe, accompanied by above-average volumes—indicating weak momentum. The index maintained a lower high–lower low structure for the fifth consecutive session and slipped below the midline of the Bollinger Bands as well as the 20-day and 50-day EMAs. The RSI dropped below the key 50 level, settling at 46.20 with a bearish crossover, while the MACD showed a negative crossover with a weakening histogram. All these indicators point to a continuation of bearish sentiment.
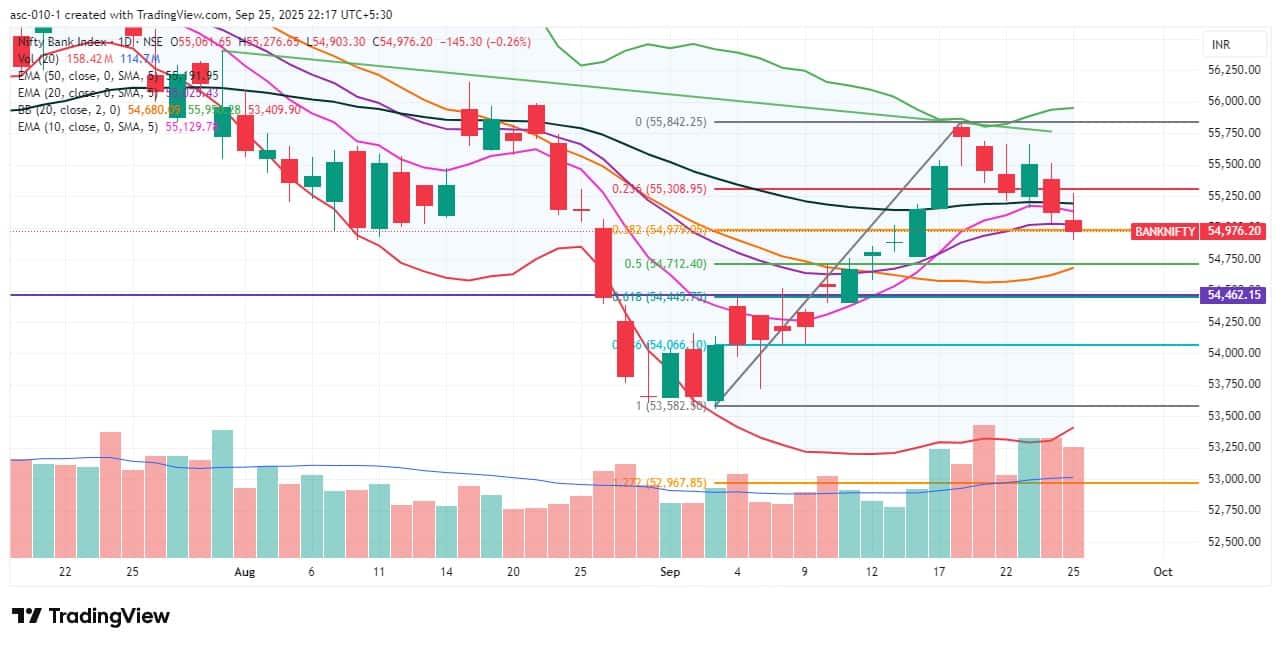
2) Key Levels For The Bank Nifty (54,976)
Resistance based on pivot points: 55,195, 55,283, and 55,425
Support based on pivot points: 54,909, 54,821, and 54,679
Resistance based on Fibonacci retracement: 55,115, 55,595
Support based on Fibonacci retracement: 54,712, 54,446
Special Formation: The Bank Nifty also formed a bearish candle with a long upper shadow on the daily timeframe, supported by above-average volumes—signaling selling pressure at higher levels. The banking index continued its lower high–lower low structure for the fifth straight session. It closed below the 10-day, 20-day, and 50-day EMAs and tested the 100-day EMA intraday. The index also saw a 38.2 percent retracement of its recent rally. The RSI, at 48.78, showed a negative crossover, while the histogram indicated fading momentum, even though the MACD remained in a positive crossover. These developments suggest emerging weakness in momentum.
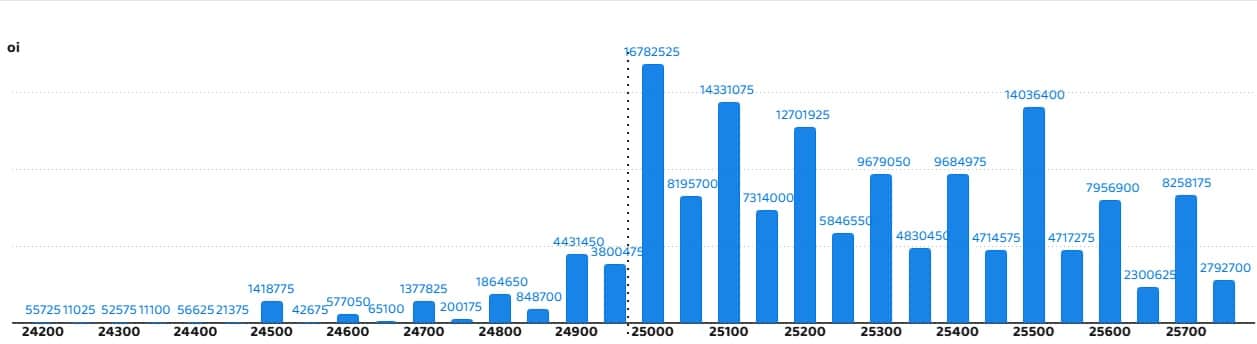
According to the monthly options data, the 25,000 strike holds the maximum Call open interest (with 1.67 crore contracts). This level can act as a key resistance for the Nifty in the short term. It was followed by the 25,100 strike (1.43 crore contracts), and the 25,500 strike (1.4 crore contracts).
Maximum Call writing was observed at the 25,000 strike, which saw an addition of 1.15 crore contracts, followed by the 25,100 and 25,050 strikes, which added 74.61 lakh and 57.52 lakh contracts, respectively. The maximum Call unwinding was seen at the 25,650 strike, which shed 3.36 lakh contracts, followed by the 24,550 and 24,200 strikes, which shed 40,725 and 11,925 contracts, respectively.
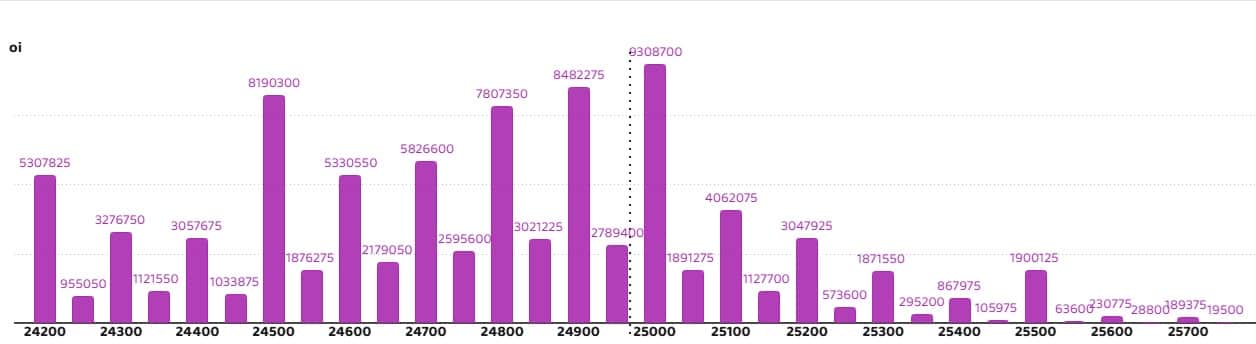
On the Put side, the maximum Put open interest was seen at the 25,000 strike (with 93.08 lakh contracts), which can act as a key level for the Nifty. It was followed by the 24,900 strike (84.82 lakh contracts) and the 24,500 strike (81.9 lakh contracts).
The maximum Put writing was placed at the 24,900 strike, which saw an addition of 25.81 lakh contracts, followed by the 24,200 and 24,800 strikes, which added 25.15 lakh and 23.12 lakh contracts, respectively. The maximum Put unwinding was seen at the 25,100 strike, which shed 16.49 lakh contracts, followed by the 25,050 and 25,000 strikes, which shed 14.39 lakh and 13.55 lakh contracts, respectively.
5) Bank Nifty Call Options Data
According to the monthly options data, the maximum Call open interest was seen at the 56,000 strike, with 18.21 lakh contracts. This can act as a key resistance level for the index in the short term. It was followed by the 57,000 strike (15.41 lakh contracts) and the 55,500 strike (14.19 lakh contracts).
Maximum Call writing was observed at the 57,000 strike (with the addition of 1.92 lakh contracts), followed by the 55,000 strike (1.53 lakh contracts), and the 55,100 strike (1.3 lakh contracts). The maximum Call unwinding was seen at the 55,400 strike, which shed 84,070 contracts, followed by 55,500 and 57,100 strikes, which shed 78,720 and 55,825 contracts, respectively.
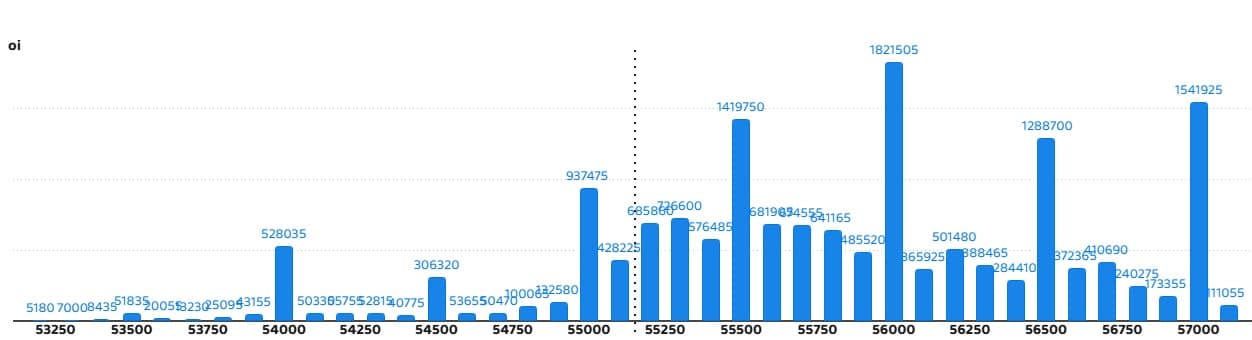
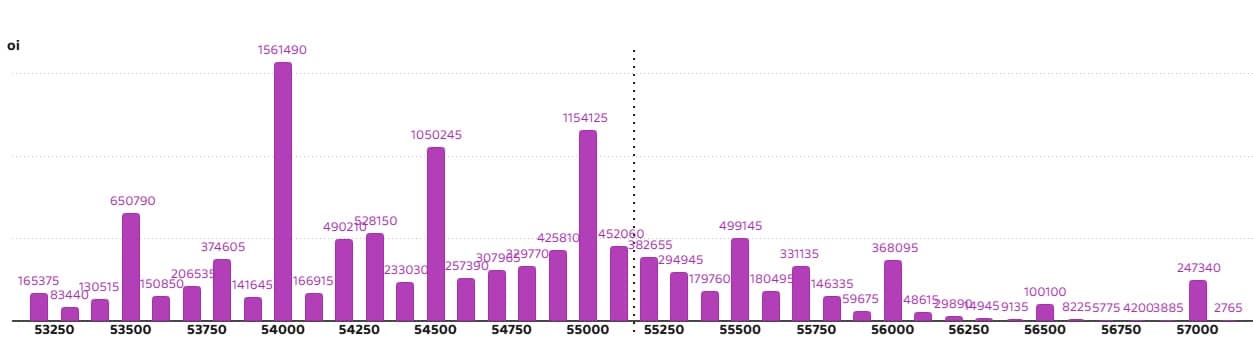
6) Bank Nifty Put Options Data
On the Put side, the 54,000 strike holds the maximum Put open interest (with 15.61 lakh contracts), which can act as a key support level for the index. This was followed by the 55,000 strike (11.54 lakh contracts) and the 54,500 strike (10.5 lakh contracts).
The maximum Put writing was observed at the 54,300 strike (which added 2.08 lakh contracts), followed by the 55,100 strike (1.82 lakh contracts) and the 54,500 strike (1.36 lakh contracts). The maximum Put winding was seen at the 55,500 strike, which shed 1.78 lakh contracts, followed by the 55,400 and 55,000 strikes, which shed 1.01 lakh and 78,680 contracts, respectively.
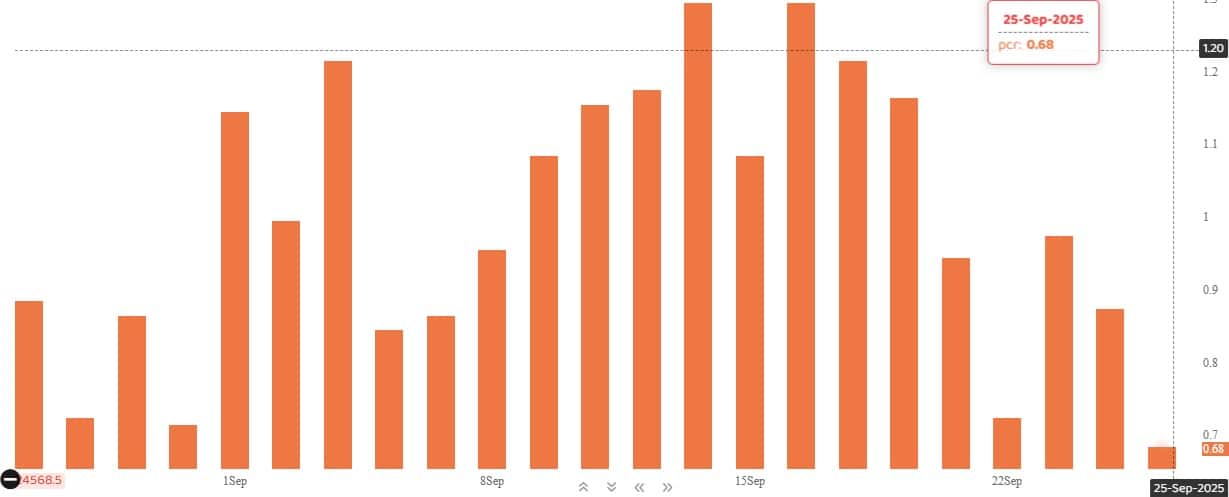
The Nifty Put-Call ratio (PCR), which indicates the mood of the market, fell to 0.68 on September 25 (the lowest level since August 8), compared to 0.87 in the previous session.
The increasing PCR, or being higher than 0.7 or surpassing 1, means traders are selling more Put options than Call options, which generally indicates the firming up of a bullish sentiment in the market. If the ratio falls below 0.7 or moves towards 0.5, then it indicates selling in Calls is higher than selling in Puts, reflecting a bearish mood in the market.
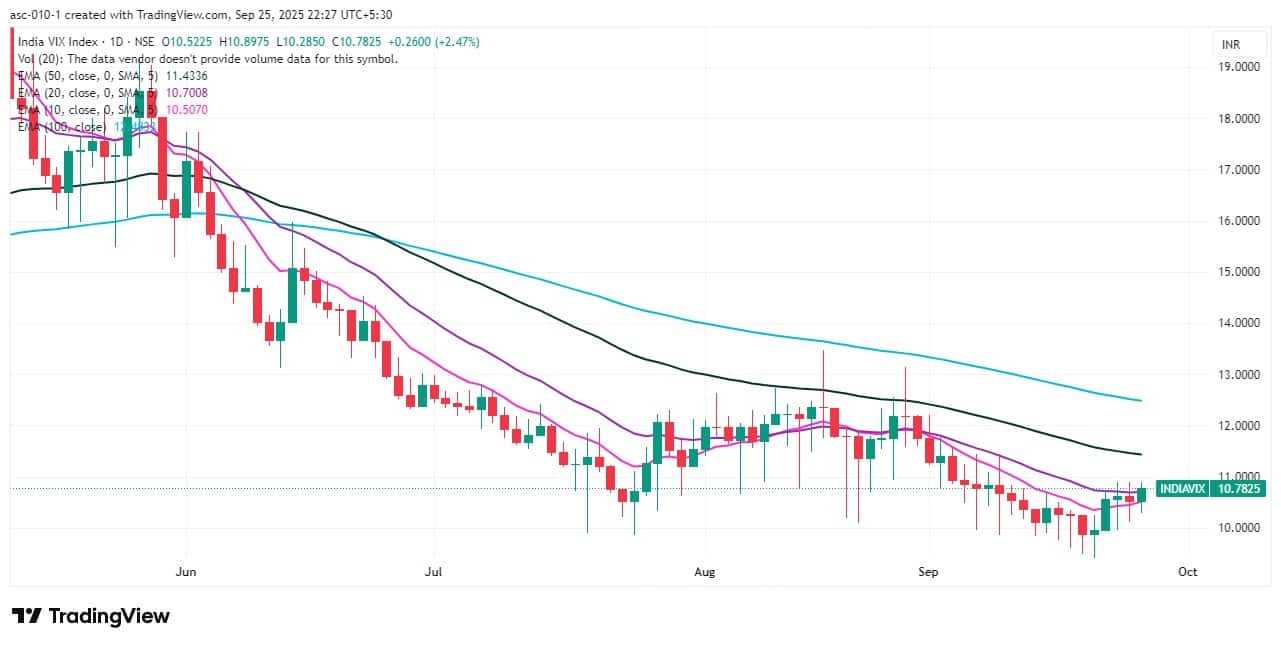
9) India VIX
The India VIX, also known as the fear index, jumped 2.47 percent to 10.78, climbing above short-term moving averages. This signals increasing discomfort for the bulls.
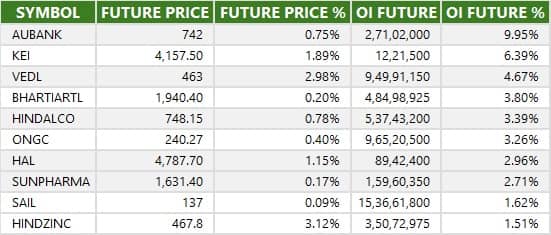
A long build-up was seen in 18 stocks. An increase in open interest (OI) and price indicates a build-up of long positions.
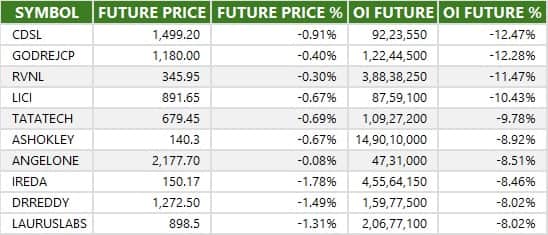
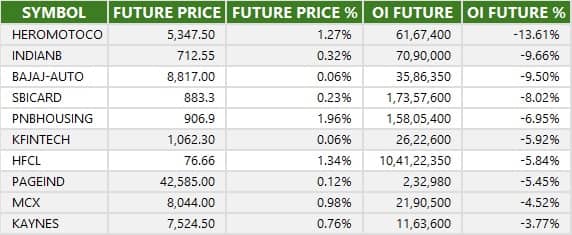
11) Long Unwinding (82 Stocks)
82 stocks saw a decline in open interest (OI) along with a fall in price, indicating long unwinding.
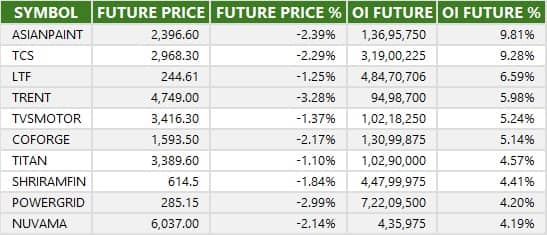
12) Short Build-up (87 Stocks)
87 stocks saw an increase in OI along with a fall in price, indicating a build-up of short positions.
13) Short-Covering (26 Stocks)
26 stocks saw short-covering, meaning a decrease in OI, along with a price increase.
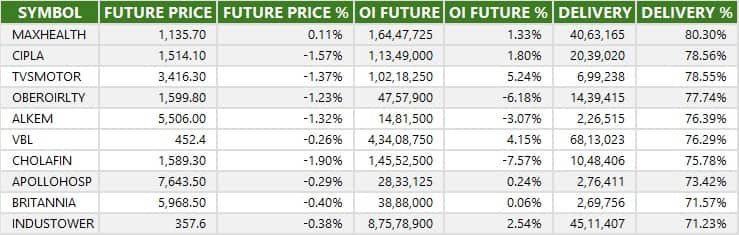
Here are the stocks that saw a high share of delivery trades. A high share of delivery reflects investing (as opposed to trading) interest in a stock.
Securities banned under the F&O segment include companies where derivative contracts cross 95 percent of the market-wide position limit.
Stocks added to F&O ban: Nil
Stocks retained in F&O ban: RBL Bank, Sammaan Capital
Stocks removed from F&O ban: HFCL
Disclaimer: The views and investment tips expressed by experts on Moneycontrol are their own and not those of the website or its management. Moneycontrol advises users to check with certified experts before taking any investment decisions.Disclosure: Moneycontrol is a part of the Network18 group. Network18 is controlled by Independent Media Trust, of which Reliance Industries is the sole beneficiary.Discover the latest Business News, Sensex, and Nifty updates. Obtain Personal Finance insights, tax queries, and expert opinions on Moneycontrol or download the Moneycontrol App to stay updated!
Find the best of Al News in one place, specially curated for you every weekend.
Stay on top of the latest tech trends and biggest startup news.


