Aditya Agarwala
Nifty has witnessed a sharp correction of 5.2 percent this month so far. However, following this correction, it is now trading close to the support line of a Broadening Wedge pattern placed in the zone of 10,880-10,855.
A sustained trade above this support will trigger a short covering rally to 11,205-11,410. However, breakdown from this Wedge support line, i.e., 10855 could drag the Index lower to 10,640-10,550.
Moreover, technical indicator RSI has reached oversold support zone at 30. Every decline from December 2016 onward has halted when RSI reaches this support zone of 30 which suggests that Index is approaching a bottom and a sharp recovery can be witnessed in the coming trading session.

Indraprastha Gas Limited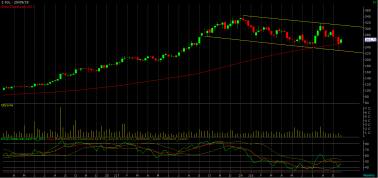 IGL Weekly Chart
On the weekly chart, Indraprastha Gas Ltd (IGL) has turned upwards after taking support at the lower end of the channel pattern placed at Rs 230. Further, a sustained trade above Rs 268 will trigger a breakout from a trendline resistance taking it higher to Rs 290-310.
On the daily chart, it is on the verge of a breakout from the neckline of a Cup & Handle pattern suggesting bullishness.
Moreover, RSI turned upwards after forming positive reversal suggesting higher levels in the coming trading sessions.
The stock may be bought in the range of Rs 263-265 for targets of Rs 290-310, keeping a stop loss below Rs 248.
Motherson Sumi Systems
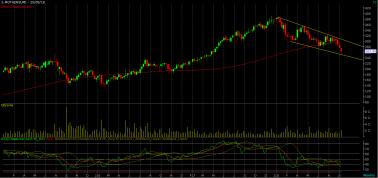
Motherson Sumi Weekly Chart
On the weekly chart, Motherson Sumi Systems Ltd has taken support at the lower end of a bullish wedge pattern placed at Rs 250. Further, the stock has completed its corrective wave A, B, C in the last leg of decline, which suggests an up move from the current level.
Further, on the daily chart, it has turned upwards after taking support at the 161.8 percent Fibonacci extension level.
RSI has turned upwards after forming a double bottom suggesting extended bullishness in the coming trading sessions.
The stock may be bought in the range of Rs 263-265 for targets of Rs 295-325, keeping a stop loss below Rs 246.
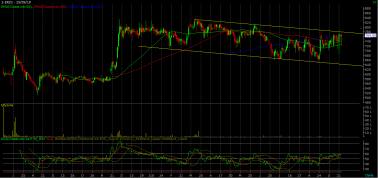
ERIS Daily Chart
On the daily chart, Eris Lifesciences Ltd is on the verge of a breakout from a channel pattern neckline placed at Rs 780. A sustained trade beyond the channel with healthy volumes can trigger a further upside.
Further, the stock has turned upwards after taking support at the 78.6 percent Fibonacci retracement suggesting higher levels in the coming sessions.
The stock may be bought in the range of Rs 763-766 for targets of Rs 815-850, keeping a stop loss below Rs 725.Disclaimer: The author is Technical Analyst at YES Securities. The views and investment tips expressed by investment experts on moneycontrol.com are their own, and not that of the website or its management. Moneycontrol.com advises users to check with certified experts before taking any investment decisions.
For more market news, click here

Discover the latest Business News, Sensex, and Nifty updates. Obtain Personal Finance insights, tax queries, and expert opinions on Moneycontrol or download the Moneycontrol App to stay updated!

Find the best of Al News in one place, specially curated for you every weekend.
Stay on top of the latest tech trends and biggest startup news.