


Caplin Point Laboratories Ltd stock price has rallied more than 50 percent in the last three months compared to a nearly seven percent rally in the Nifty during the same period.
On a year-to-date basis, Caplin has outperformed the benchmark index, up more than 32 percent compared to over 12 percent rally in the Nifty and 17 percent gains seen in the BSE 500 index.
Caplin Point Ltd, with a market-capitalisation of more than Rs 500 crore, is on track to surpass its 52-week high of Rs 694.40 and reach closer to Rs 780 in the coming months, an upside of 16 percent from current levels.
Established in 1990 by first-generation entrepreneur CC Paarthipan, Caplin has established a strong as well as a deep presence in semi-regulated markets of Central America (CA) such as Guatemala, El Salvador, Nicaragua, Ecuador, and Honduras among others.
It is also one of the leading formulation suppliers in these regions.
Pharma stocks are regaining upward momentum after a couple of weeks' breather, but stock-specific performance is likely to continue even though there is some consolidation in benchmark indices.
“Within midcap pharma pack we expect Caplin Point Laboratories to relatively outperform, as it entirely retraced its past seven months decline in just three months. The faster pace of retracement indicates structural improvement that augurs well for the next leg of up move,” Dharmesh Shah, Head – Technical, ICICI direct said.
The past seven months' decline from Rs 686 was recorded on August 7, on the weekly charts to Rs 402 on March 31.
After hitting a low of Rs 402, the stock bounced back to hit a 52-week high of Rs 694 on June 15 and in the coming months, could well break above 700-750 levels.
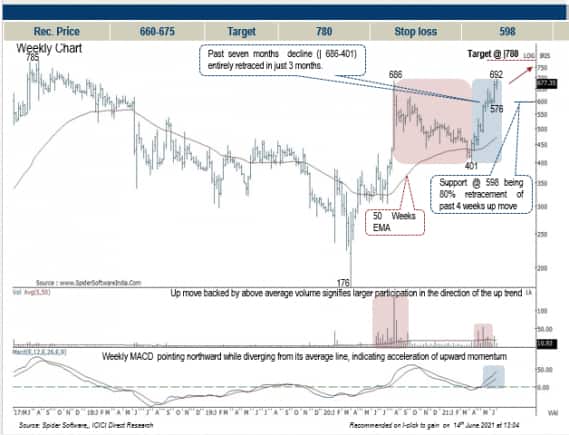
“We expect the stock to resolve higher and gradually head towards our earmarked target of Rs 780 in the coming months, as it is a confluence of 138.2 percent external of August 2020- March 2021 decline (| 686-401) coinciding with an all-time high of 785 recorded in August 2017,” added Shah.
The key point to highlight is that on multiple occasions 50 weeks EMA (exponential moving average) has acted as a strong support. Even in the current scenario, strong buying demand emerged from the 50 weeks EMA backed by rising volumes.
On the oscillator front, weekly MACD (Moving Average Convergence Divergence) is pointing northward while diverging from its average line, indicating acceleration of upward momentum
Disclaimer: The views and investment tips expressed by experts on Moneycontrol.com are their own and not those of the website or its management. Moneycontrol.com advises users to check with certified experts before taking any investment decisions.

Discover the latest Business News, Sensex, and Nifty updates. Obtain Personal Finance insights, tax queries, and expert opinions on Moneycontrol or download the Moneycontrol App to stay updated!
Find the best of Al News in one place, specially curated for you every weekend.
Stay on top of the latest tech trends and biggest startup news.


