


Indices and stocks have not seen a strong correction in the last many years. We have been off the highs by 15-20 percent at best but nothing meaningful. While this is good for the buyers, it does pose a challenge.
The challenge is to figure out when to stop in terms of buying efforts especially when we are on our way up. I believe we can take cues from volatility to get an early indication. But before we do that let us revise 2 basic characteristics of equity and volatility.
For volatility, we are referring to the volatility implied by the premiums of Options. This is a figure easily calculated using a mathematical formula. One does not need to do that because many options analytics applications hold this information already including websites of the exchanges where these options are traded.
Implied volatility (IV) has 2 basic characteristics.
1. It is range-bound (mean reverting) in nature.
2. It is negatively corelated with the underlying stock or index.
1st is a fairly straightforward observation. More of it is what it is scenario. On the other hand, 2nd characteristic has a logic behind it. The logic is if a stock or an index falls it falls with higher momentum or volatility but if the same stock or index is rising it will rise at a slower rate.
The reason behind this is the rise or constructive move always takes time, but destruction or fall can come in faster. More of a natural way for any asset class to behave.
Once we add both 1st & 2nd characteristics, we get a trading system. Now every time the IV is at the lower end we can expect it to go up. With IV going up the price of the underlying can be expected to go down.
This is exactly what we are going to use to make an easy observation about the expectation of a rise in IV or in other words fall in the underlying. This is where we can place stop losses in our Buy trade.
I will explain this with an example of the Nifty index. However, the same can be applied to the stocks with their respective chart of IV of the option closest to the current market price.
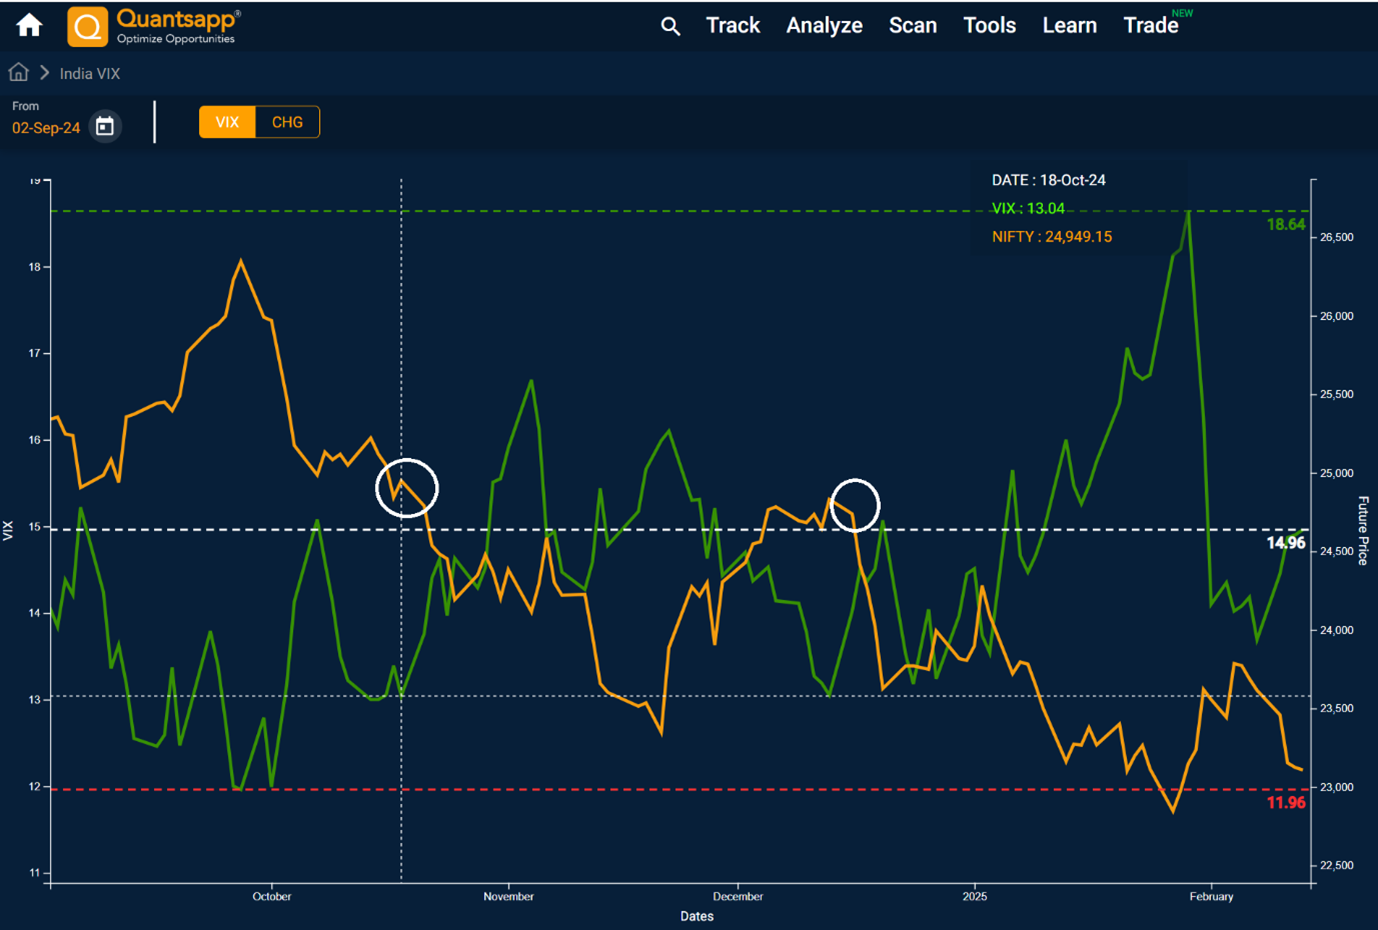
As a proxy of IV for Nifty we are using India VIX. India VIX can be defined as the index of IV of all Nifty Options in simple words. The reason for using it is that it is publicly available even on the chart form on many websites.
Action Point:
1. Mark the lowest point of the last 6 months
2. Alert yourself once the Lowest point + 10% is reached in India VIX
3. Wait for India VIX to close with an increment day over day after step 2 is alerted.
4.
This is your time to act. If you don’t want to exit just tighten the stop loss of the buy trades as much as you can.
Look at this picture for visual understanding.

Discover the latest Business News, Sensex, and Nifty updates. Obtain Personal Finance insights, tax queries, and expert opinions on Moneycontrol or download the Moneycontrol App to stay updated!


Find the best of Al News in one place, specially curated for you every weekend.
Stay on top of the latest tech trends and biggest startup news.


