


The Indian economy has grown by leaps and bounds after attaining Independence in 1947. The history of trade and commerce in the Indian subcontinent can be divided into many phases — deindustrialization induced by colonization, socialist central planning in the aftermath of Independence and free market economics after the liberalization reforms of 1991.
India’s share of the world economy slipped from around 25 percent in 1700 to 4.2 percent in 1950. A century under colonial rule had sapped the country’s entrepreneurial spirit. The country was forced to divert its raw materials to feed the mechanized factories that had sprung up in Britain during the industrial revolution. Poverty and famine was rampant.
After the British left Indian shores, the newly elected government charted a course for the country that entailed capital controls and central planning, much along the lines of the Soviet Union. Even though the ruling dispensation at the time had pledged non-alignment, it was seen as sympathetic to the socialist cause. The overarching role of the government in the country’s economy is testament to Moscow’s influence. It was a period of institution building that laid the foundation for the modern republic, but trade barriers, red tape and curbs on private enterprise curtailed the economy from reaching its potential.
The government continues to be the prime driver of growth, but things changed after the reforms of 1991. A balance-of-payments crisis forced the government to open up its economy, leading to greater foreign investment and easing of the norms regarding setting up businesses in the country. India is today one of the fastest growing economies in the world.
Here is a look at how some macroeconomic indicators have fared since India attained Independence in 1947.
Since 1952, the rupee has lost over 93 percent of its value against the US dollar, falling from Rs 4.75 to nearly Rs 70. The rupee breached the Rs 70/dollar mark for the first time on August 14, on the eve of India’s 71st Independence Day. The rupee hovered around the Rs 17.5/dollar mark during much of the 90s. It remained relatively stable in the neighbourhood of Rs 45/dollar for over a decade after the turn of the millennium. In 2011, the average annual exchange rate for the rupee was Rs 46.61. In the space of seven years, the value of the rupee has fallen to Rs 70.
In the national context, the month of August is auspicious for more than one reason. In August 1958, the government recognized the Bombay Stock Exchange as the first bourse to come under the Securities Contracts (Regulation) Act. 1992 was also a major milestone for the financial sector. The National Stock Exchange and market watchdog Securities and Exchange Board of India (SEBI) were set up in 1992.
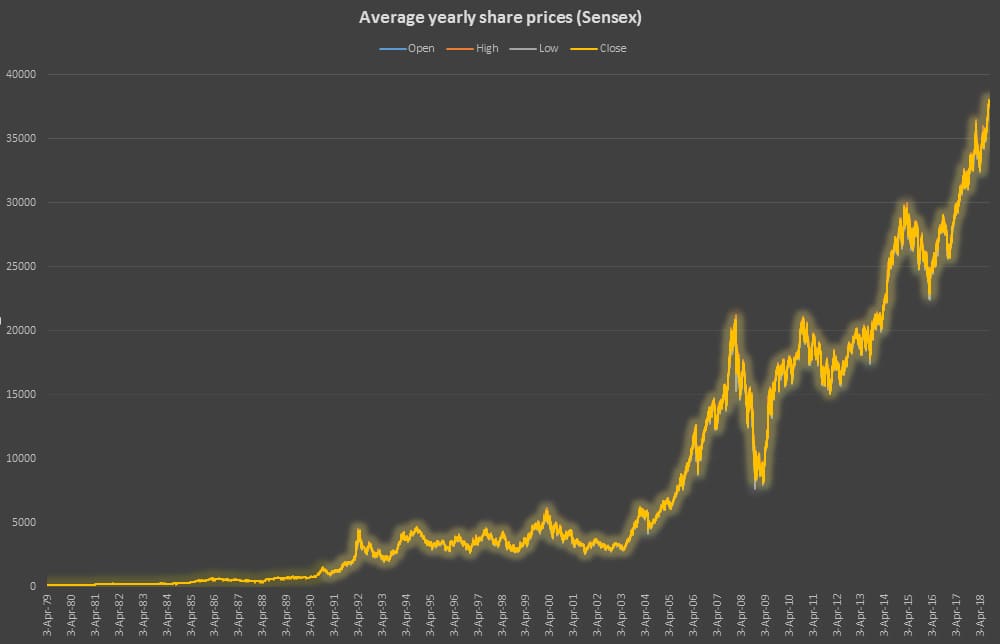
Equity markets have weathered transient volatility to post robust returns. Long-term investors in Indian equities have reaped the benefits. On an average, the Sensex has gone from Rs 100 in April 1979 to over Rs 37,000 today.
Government debt
India was cautious of borrowing from overseas in the days following Independence. However, it shed its post-colonial inhibitions soon after, and after half a century of tepid growth, the government took to raising from through the debt market. Total government debt rose from 25 percent of the GDP in 1948 to 69.07 percent in 2015. It peaked at 84.24 percent in 2003, with the previous high coming in 1992, when the government was forced into accepting an emergency loan from International Monetary Fund (IMF).
The consumer price index (CPI) has remained range-bound, touching double digit-figures 16 times in the last 70 years. The metric used for this calculation is the CPI for industrial workers, the data for which is collated by the Labour Bureau. Inflation (CPI) touched a high of 28 percent in 1974.
Hyperinflation was caused by the rising debt burden of the 1971 war which resulted in the liberation of Bangladesh, deficit payments for which stretched to the following years. The government responded to the crisis by printing more notes. Moreover, this period coincided with the world’s first oil crisis, whereby the Organization of the Petroleum Exporting Countries (OPEC) slashed production and raised prices.
Inflation touched 13.87 percent in 1991, an inflection point for the Indian economy. The next time inflation breached the 13-percent mark was in 1998, a year before the Kargil war. Keeping inflation in check is important for political parties as public sentiment is influenced by price rise. The last time inflation breached the 10 percent-mark was in 2013. The UPA coalition was voted out of power in the subsequent year.
India’s foreign exchange reserves have grown manifold since independence. As trade barriers were slowly eliminated, Indian companies started accruing foreign currency, which was deposited with the Reserve Bank of India (RBI). Forex include India’s holdings of bonds, cash and financial assets denominated in foreign currencies. It also includes assets held as special drawing rights (SDR), gold and the nation’s reserve trance position (RTP).
SDR are supplementary foreign exchange assets held by the IMF, which can be exchanged by countries to supplement a shortfall in gold reserves or dollar assets. The IMF’s foreign exchange assets are collected by aggregating contributions from member states of the United Nations. RTP is the difference each member country’s contribution to the fund and its mandated quota. If the difference is positive, the remainder can be considered as a part of the country’s foreign exchange reserve. From $762 million in 1959-60, India’s forex reserves have risen by 48,450 percent to $369.95 billion in 2016-17. Foreign currency assets account for 94 percent of India’s forex reserves as on 2016-17, while $19.86 billion was held in gold.
India’s gross domestic product (GDP) crossed the $100 billion for the first time in 1976, 29 years after attaining Independence. It reached the $200 billion mark in 1983. However, economic growth became much more brisk following the economic reforms of 1991.
Between 2005 and 2010, the GDP doubled from $808.9 billion to $1.65 trillion ($1,657 billion). In 2017, India’s GDP was $2.59 trillion, making it the sixth largest economy in the world.
In all the years after Independence, the GDP grew by over 10 percent only once. In 2010, India posted a GDP growth rate of 10.26 percent. Since then it has remained within the range of 6-8 percent. It is still a far cry from the early years of the republic, when growth was lukewarm, and often negative.
Between 1950 and 1980, the average growth rate was 3 percent, when compared to other economies of comparable scale such as Taiwan and South Korea, which grew at 12 percent and 10 percent respectively. During this period, the Indian economy earned a dubious distinction of being a serial underperformer. Several economists went to the extent of calling this transitory phase in the economy as being marked by a “socialist growth rate” or “Hindu growth rate”.
However, to a large extent, India was largely unaffected by the financial crisis of 1997 which had its epicenter in southeast Asia, toppling the foundations of the very economies which had raced past India in the bygone decades. India also established itself as a relatively stable market for global investors, posting a GDP growth of 8.48 percent in 2009, barely a year after the subprime mortgage crisis in the United States.
The outlook looks positive for the Indian economy. In its report published on August 8, IMF predicted that India will grow at 7.3 percent in 2018-19.
(Update: The piece has been updated to reflect the average of share prices on the Sensex after 1979. The error is regretted)
Discover the latest Business News, Sensex, and Nifty updates. Obtain Personal Finance insights, tax queries, and expert opinions on Moneycontrol or download the Moneycontrol App to stay updated!
Find the best of Al News in one place, specially curated for you every weekend.
Stay on top of the latest tech trends and biggest startup news.


