


Equity benchmarks closed a volatile session with a one-third percent loss on January 21, with market breadth consistently favouring bears. A total of 2,067 shares saw correction compared to 882 advancing shares on the NSE. A doji-like pattern formation and oversold RSI signal the possibility of a bounce-back, but the sustainability of the same remains key to watch. Below are some short-term trading ideas to consider:
Arun Kumar Mantri, Founder of Mantri FinMart
Tech Mahindra | CMP: Rs 1,686.7
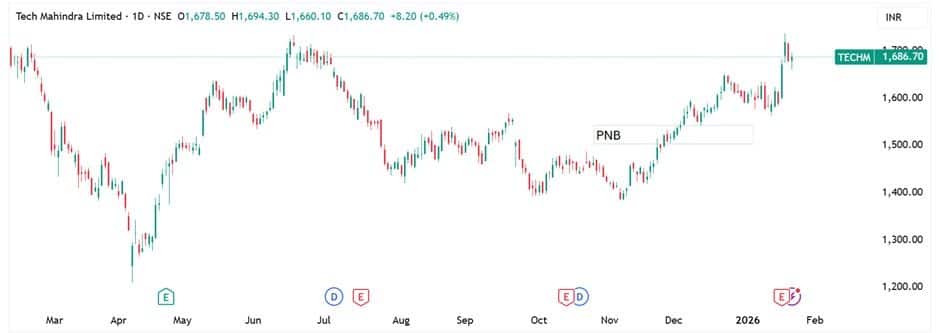
Tech Mahindra is showing inherent strength, with short-term signs of base formation after a corrective move from recent highs. The stock is trading around its short-term moving averages (20-DMA and 50-DMA), indicating bullish sentiment, while the RSI is hovering near the lower band (around 35–40), suggesting the stock is close to oversold territory and may see a technical pullback.
Momentum indicators remain muted, but selling pressure is gradually reducing near support zones, and some upside momentum may resume in the near-term period.
Strategy: Buy
Target: Rs 1,744
Stop-Loss: Rs 1,652
UltraTech Cement | CMP: Rs 12,231
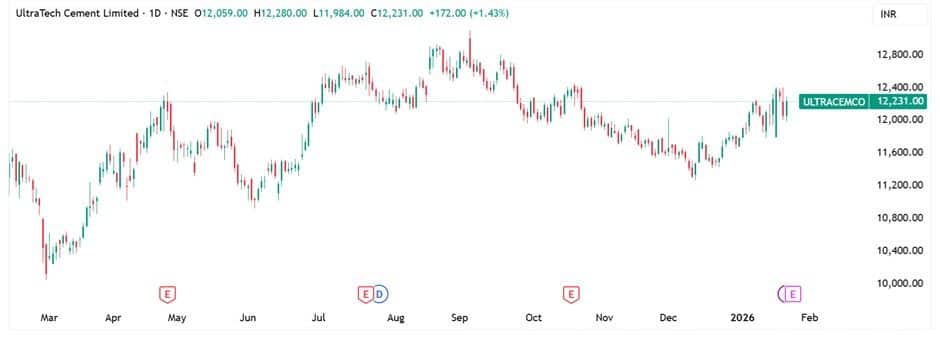
UltraTech Cement is showing initial signs of short-term base formation, coupled with healthy trading volumes. On technical indicators, the stock is trading around its key moving averages of 20-, 50-, and 200-day, which are providing support and indicating broader bullish sentiment.
Further, oscillators such as the RSI are in neutral territory, suggesting neither strong overbought nor oversold conditions, while MACD readings and some short-term averages indicate cautious momentum. Overall, this suggests price consolidation with a bullish bias. If key support levels hold, the price may move towards the Rs 12,500-plus zone.
Strategy: Buy
Target: Rs 12,594
Stop-Loss: Rs 12,010
TVS Motor Company | CMP: Rs 3,602
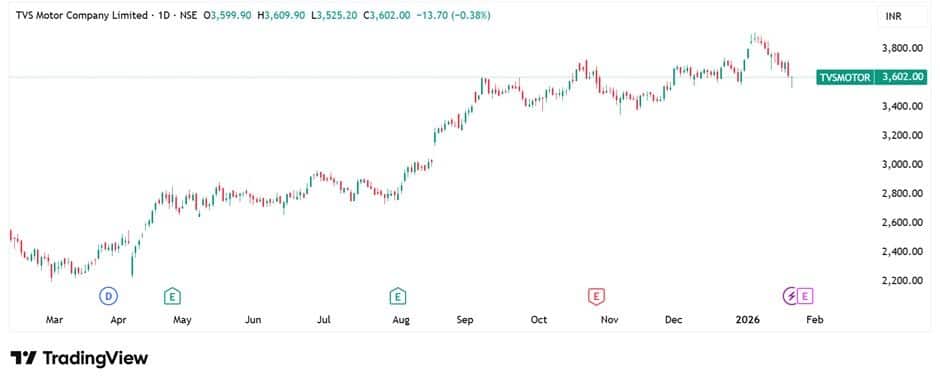
TVS Motor is currently hovering around strong support zones of Rs 3,550–3,600 on the daily charts. Technical indicators are showing mixed signals, with short-term base formation coupled with oversold conditions that may attract some counter-trend buying at the current juncture.
On the daily chart, key momentum tools like the RSI are deeply oversold, while oscillators such as MACD and Stochastic suggest oversold zones on short-term momentum indicators.
On the other hand, any price break below the Rs 3,500 zone, which is a key support, may suggest a continuation of the ongoing correction, while any sustained move above it may resume short covering in the counter. Resistance for the price is around Rs 3,770–3,790 on the short-term timeframe.
Strategy: Buy
Target: Rs 3,753
Stop-Loss: Rs 3,512
Sudeep Shah, Head - Technical and Derivatives Research at SBI Securities
JK Tyre and Industries | CMP: Rs 510.95
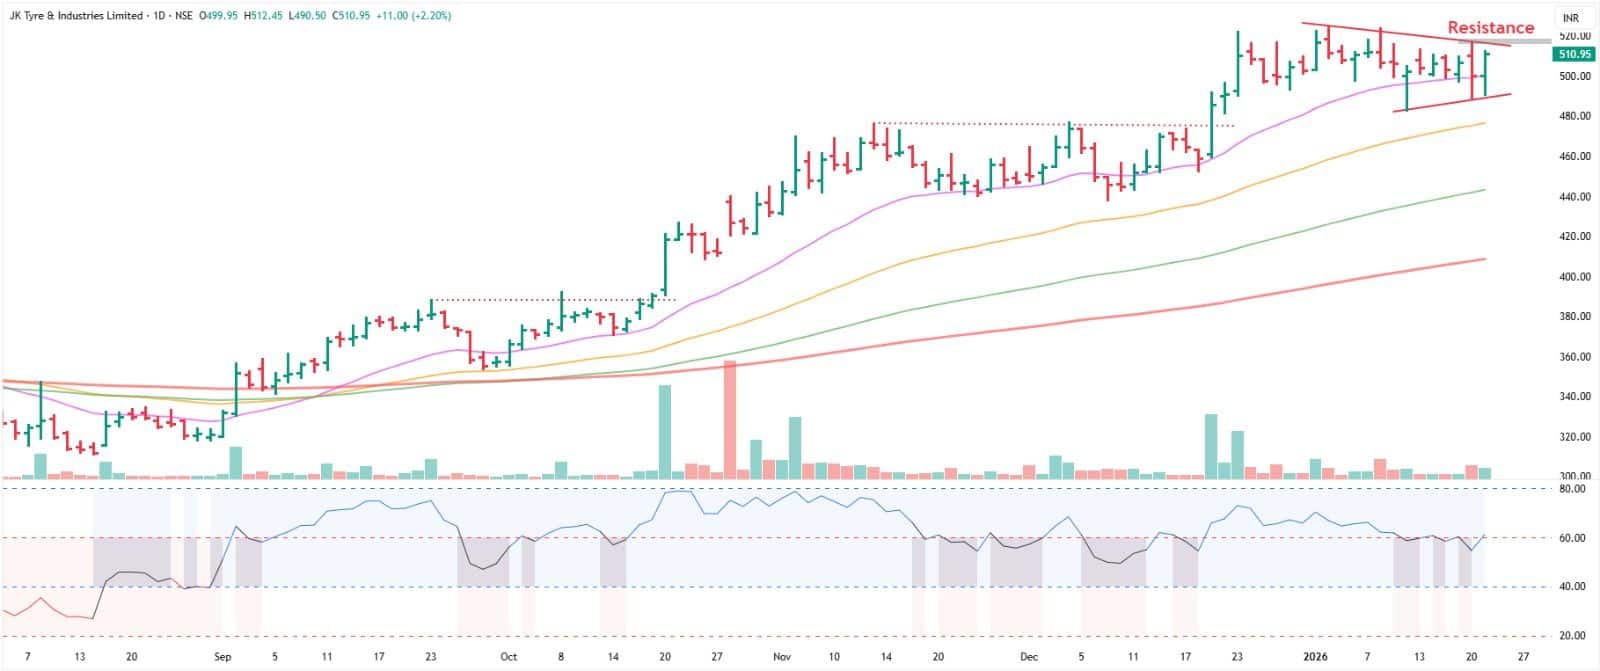
JK Tyre has been consolidating in the Rs 525–483 range since December 23, indicating a healthy pause after the prior move. Despite the sideways action, the stock continues to hold above its 20-day EMA, which is acting as a dynamic support.
The RSI has reclaimed the 60 level, while the MACD remains above both the signal and zero lines. Holding above the Bollinger Band midline, momentum indicators suggest the stock is well positioned for an upside breakout. Hence, we recommend accumulating the stock in the zone of Rs 510–505.
Strategy: Buy
Target: Rs 545
Stop-Loss: Rs 490
One 97 Communications Paytm | CMP: Rs 1,235.9
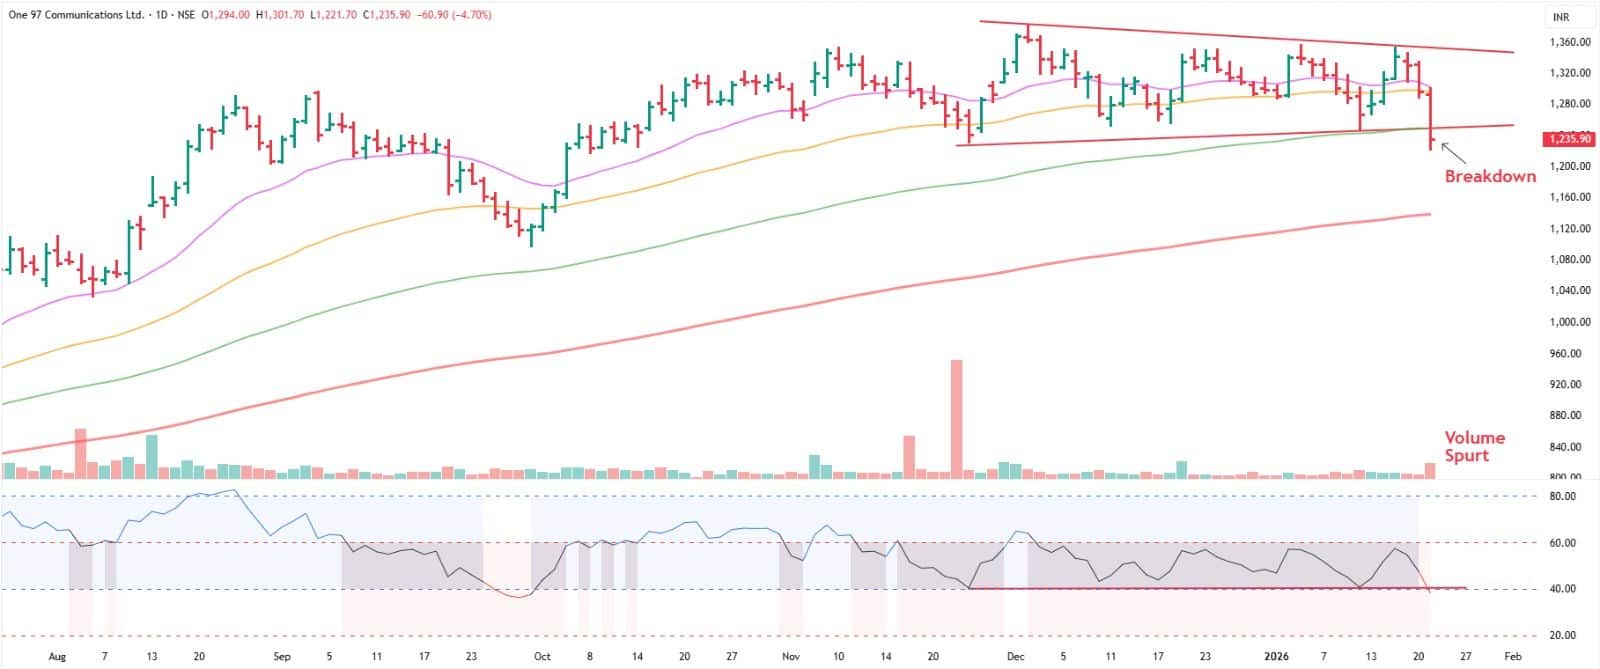
Paytm had been consolidating in the Rs 1,248–1,357 range since early December, but repeated failures near the Rs 1,355–1,360 resistance zone signalled exhaustion. The stock has now broken below the lower end of this range, closing lower on January 21, confirming a bearish breakdown.
Momentum indicators have deteriorated sharply, with the RSI slipping below 40 and DI– crossing above DI+, indicating growing bearish control. The MACD remains below both the signal and zero lines, suggesting further downside risk in the near term.
Hence, we recommend selling the stock in the zone of Rs 1,235–1,230 with a stop-loss of Rs 1,265. On the downside, it is likely to test the level of Rs 1,130 in the short term.
Strategy: Sell
Target: Rs 1,130
Stop-Loss: Rs 1,265
Rupak De, Senior Technical Analyst at LKP Securities
Hindustan Zinc | CMP: Rs 697.55
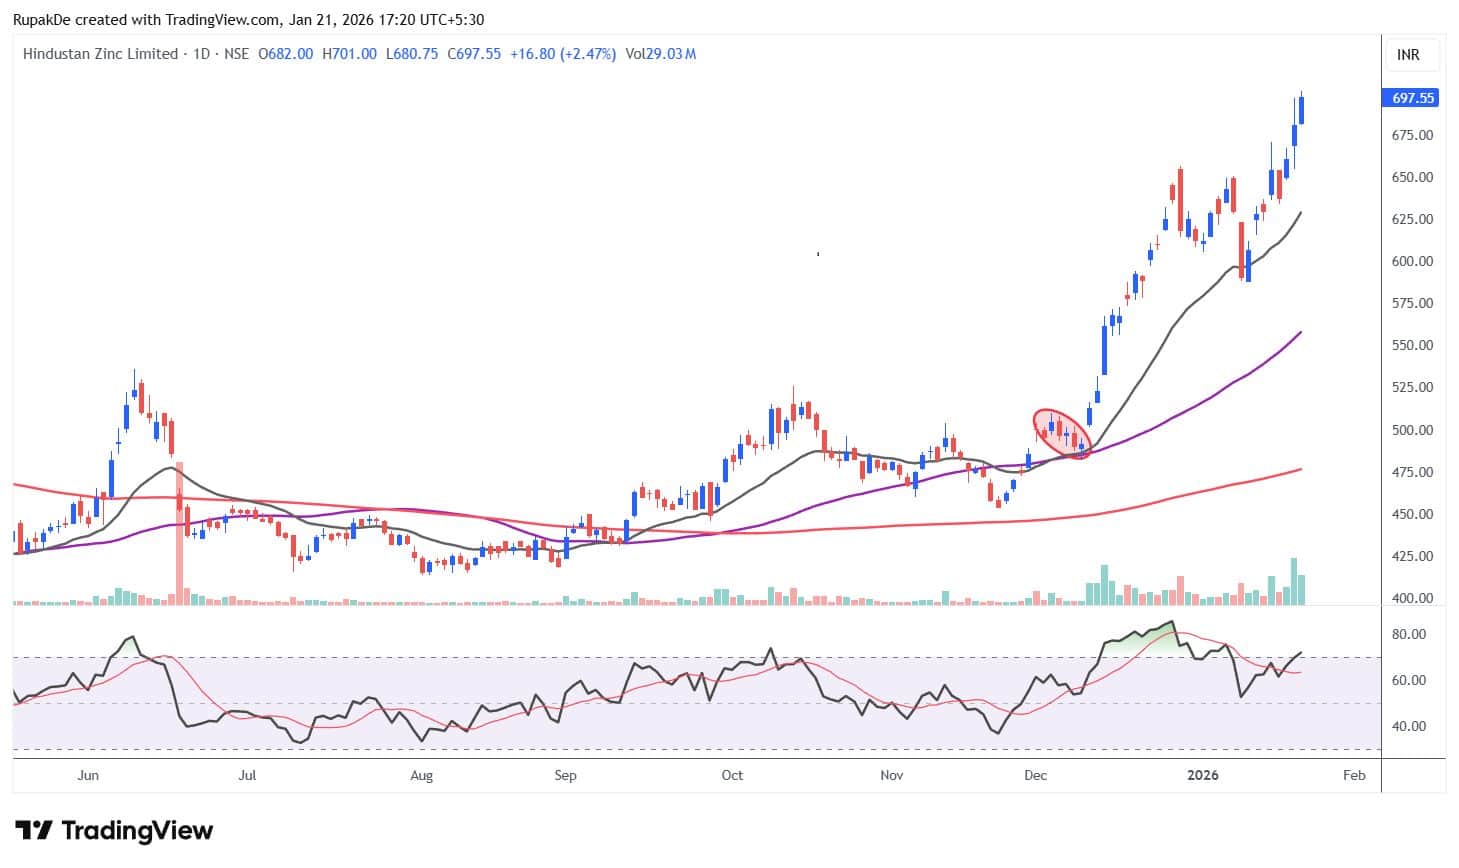
Hindustan Zinc has been on a dream run, with the ascending chart pattern remaining intact across multiple timeframes. Dips are being bought, and rallies remain strong.
The RSI has recently re-entered a bullish crossover, and the price continues to trade comfortably above the 20 EMA. In the short term, the trend is likely to remain strong, with the potential to rally towards Rs 730. Support is placed at Rs 685; a break below this level could lead to a decline.
Strategy: Buy
Target: Rs 730
Stop-Loss: Rs 685
Aditya Birla Capital | CMP: Rs 346.25
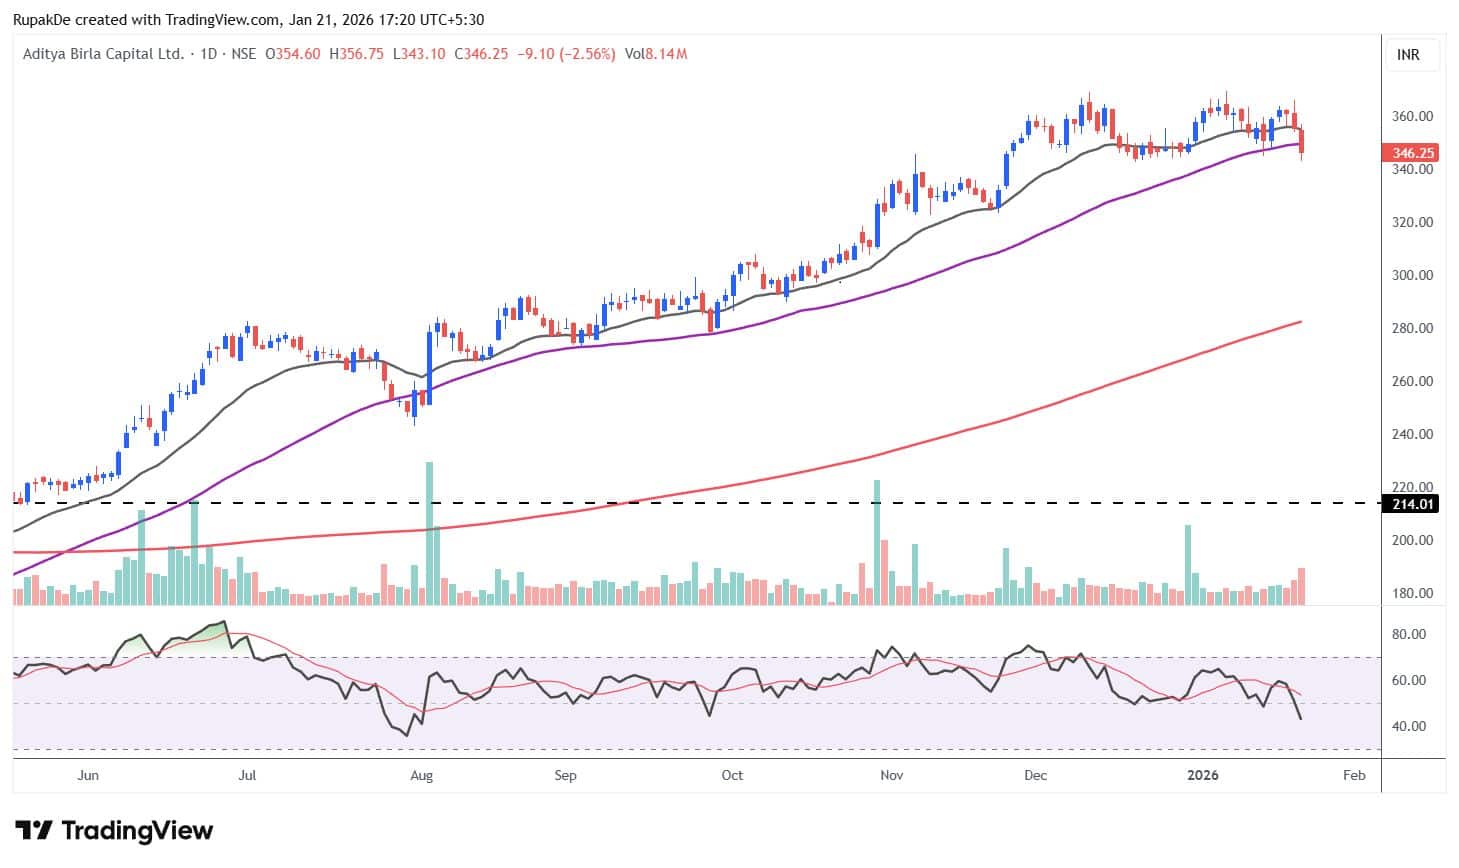
Aditya Birla Capital has seen increased weakness following a breakdown from recent consolidation. The stock has also fallen below both the 20 EMA and the 50 DMA, strengthening bearish sentiment.
The RSI is in a bearish crossover, indicating the possibility of further downside. In the short term, the trend is likely to remain weak, with the potential to fall towards Rs 331, while resistance is placed at Rs 353, above which sentiment may improve.
Strategy: Sell
Target: Rs 331
Stop-Loss: Rs 353
Havells India | CMP: Rs 1,316
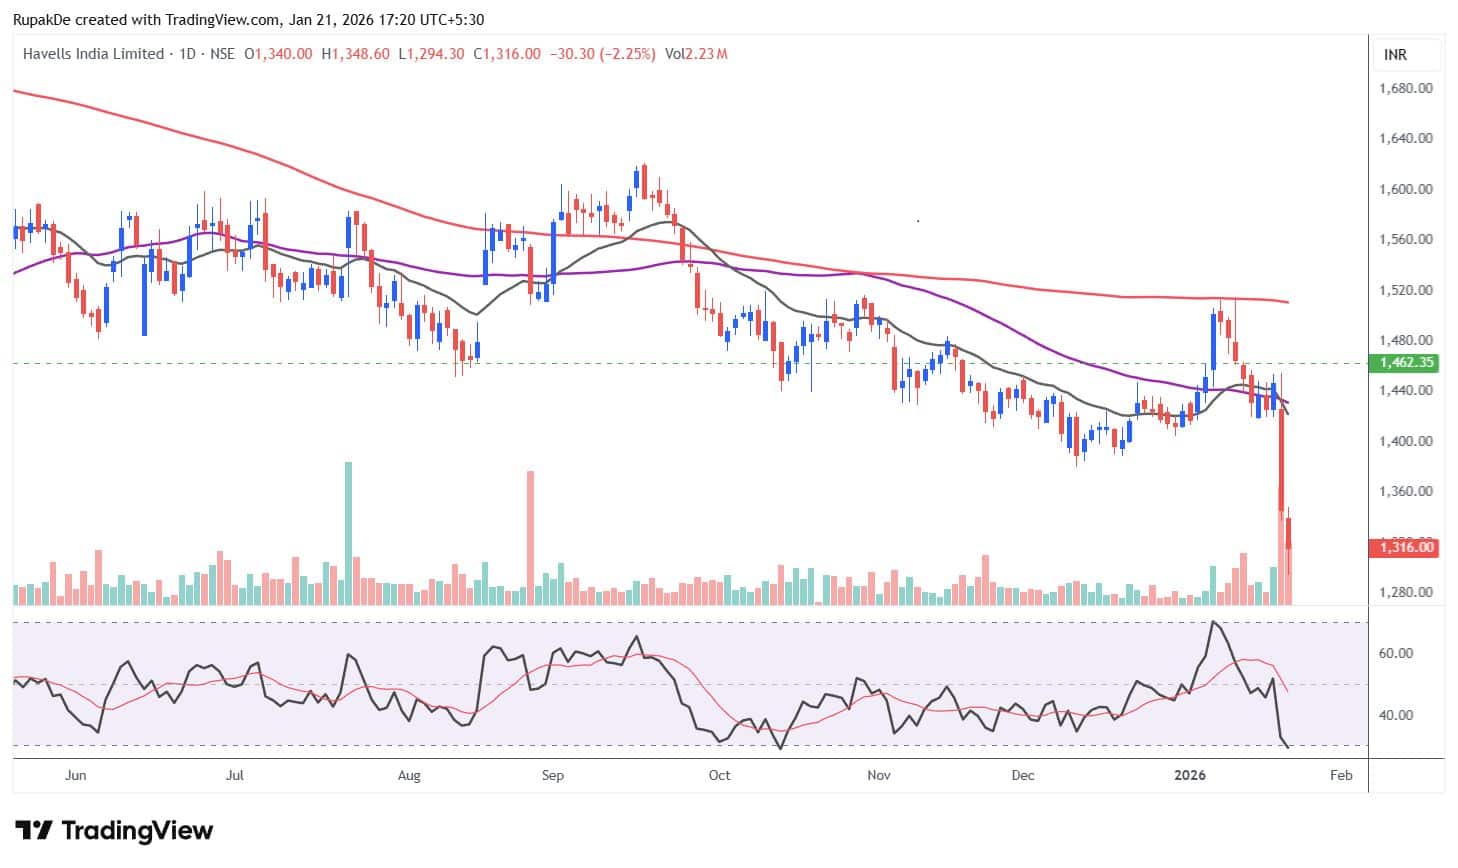
Havells India’s chart looks weak, as the stock has declined after breaking down from recent consolidation. In addition, the stock has been sustaining below the 20 EMA for the last two sessions, confirming a bearish trend. The RSI is in a bearish crossover and continues to fall, further strengthening bearish sentiment.
In the short term, the trend is likely to remain weak, with the potential to drift towards Rs 1,280. However, after the sharp fall over the last two days, it would be prudent to sell on rallies rather than at current levels. Resistance is placed at Rs 1,365; a move above this level could improve sentiment.
Strategy: Sell
Target: Rs 1,280
Stop-Loss: Rs 1,365
Disclaimer: The views and investment tips expressed by experts on Moneycontrol are their own and not those of the website or its management. Moneycontrol advises users to check with certified experts before taking any investment decisions.Discover the latest Business News, Sensex, and Nifty updates. Obtain Personal Finance insights, tax queries, and expert opinions on Moneycontrol or download the Moneycontrol App to stay updated!
Find the best of Al News in one place, specially curated for you every weekend.
Stay on top of the latest tech trends and biggest startup news.


