


Equity benchmark indices closed flat after a couple of days of rally, but market breadth remained healthy on December 23. About 1,651 shares gained compared to 1,197 shares, which were supported by bears, on the NSE. Overall, the trend remains positive despite consolidation, and closing above Tuesday’s high is crucial for further upside. Below are some short-term trading ideas to consider:
Amol Athawale, VP Technical Research at Kotak Securities
Larsen & Toubro | CMP: Rs 4,058.8
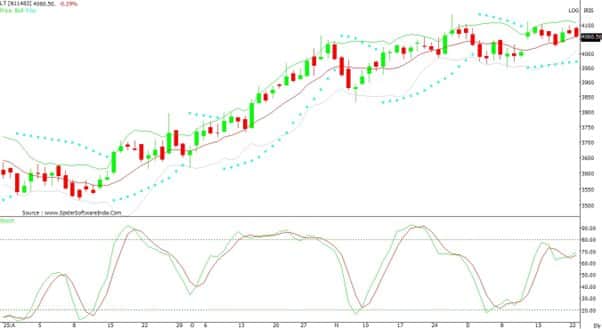
Over the last couple of weeks, L&T has been witnessing range-bound activity. However, the medium-term trend remains positive. On the daily charts, the stock is forming a series of higher highs and higher lows, indicating a further uptrend from the current levels.
For trend-following traders, Rs 4,000 would act as a key support zone. Above this level, bullish momentum is likely to continue, with potential upside targets around Rs 4,250–4,260.
Strategy: Buy
Target: Rs 4,250-4,260
Stop-Loss: Rs 4,000
Bajaj Finserv | CMP: Rs 2,047.6
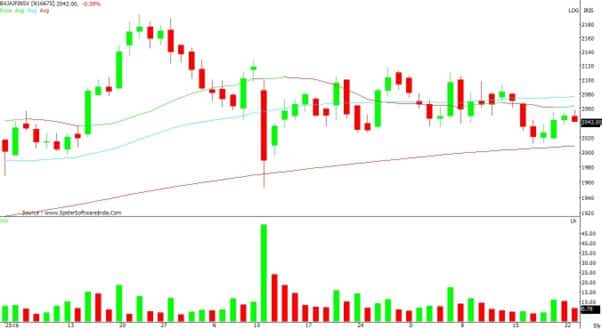
After a short-term correction, Bajaj Finserv is trading near the 200-day SMA (Simple Moving Average). Technically, short-term support is placed at the Rs 2,000 level. The short-term formation indicates a strong possibility of a fresh uptrend rally from the current levels.
For positional traders, the Rs 2,000 level or the 200-day SMA would act as key support zones. Above these levels, the stock could move up to Rs 2,120–2,130. However, below Rs 2,000, the uptrend would become vulnerable.
Strategy: Buy
Target: Rs 2,120, Rs 2,130
Stop-Loss: Rs 2,000
HDFC Life Insurance Company | CMP: Rs 763.95
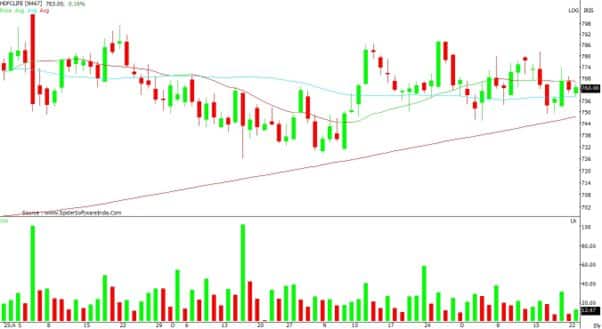
After a promising reversal formation, HDFC Life Insurance is witnessing range-bound activity near the 50-day SMA (Simple Moving Average). However, the short-term formation of the stock remains positive. Technically, on the daily charts, it has formed a double bottom pattern, indicating a strong possibility of a fresh uptrend rally from the current levels.
Unless it trades below Rs 745, positional traders should retain an optimistic stance and look for a target of Rs 800. Fresh buying can be considered now and on dips, if any, between Rs 765 and Rs 755 levels, with a stop-loss below Rs 745.
Strategy: Buy
Target: Rs 800
Stop-Loss: Rs 745
Nandish Shah, Senior Technical Research Analyst at HDFC Securities
Ceat | CMP: Rs 3,903.2
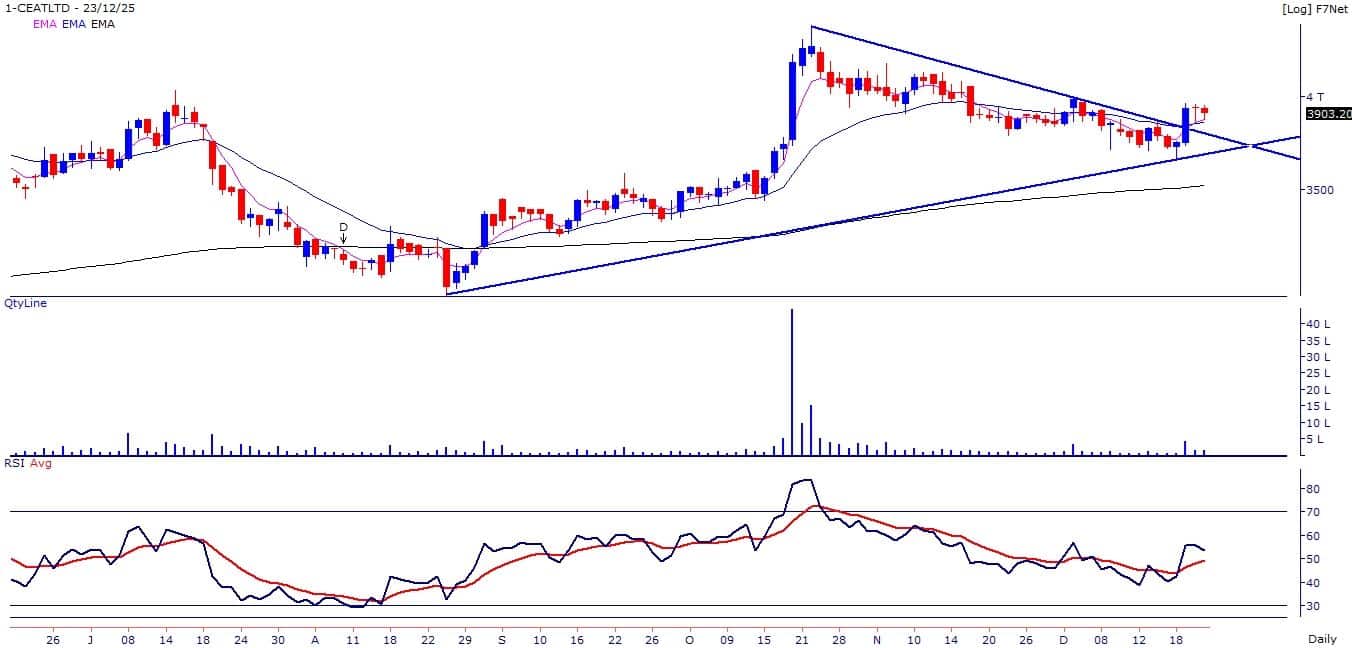
The primary trend of Ceat remains up, as it is trading above its 200-day moving averages. The stock price has broken out from a symmetrical triangle on the daily chart. Accumulation has been observed in the stock over the last few months, with up-day volumes sharply higher than down-day volumes. The stock price has been forming a bullish higher top–higher bottom formation on the weekly and monthly charts.
Strategy: Buy
Target: Rs 4,140, Rs 4,250
Stop-Loss: Rs 3,700
Stylam Industries | CMP: Rs 2,281.3
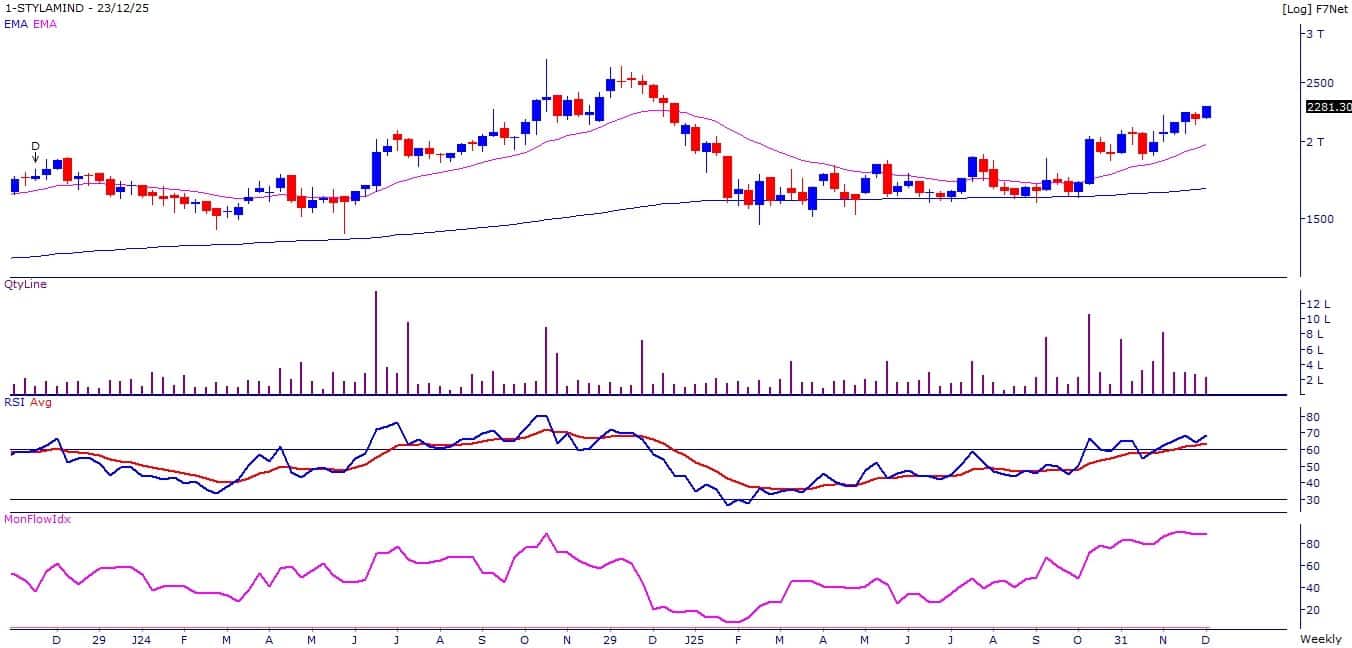
Stylam Industries has been forming a bullish higher top–higher bottom formation on the daily chart. Accumulation has been observed in the stock over the last few months, with up-day volumes sharply higher than down-day volumes. The stock price has also broken out on the monthly chart.
Strategy: Buy
Target: Rs 2,480, Rs 2,550
Stop-Loss: Rs 2,100
Sandhar Technologies | CMP: Rs 580.95
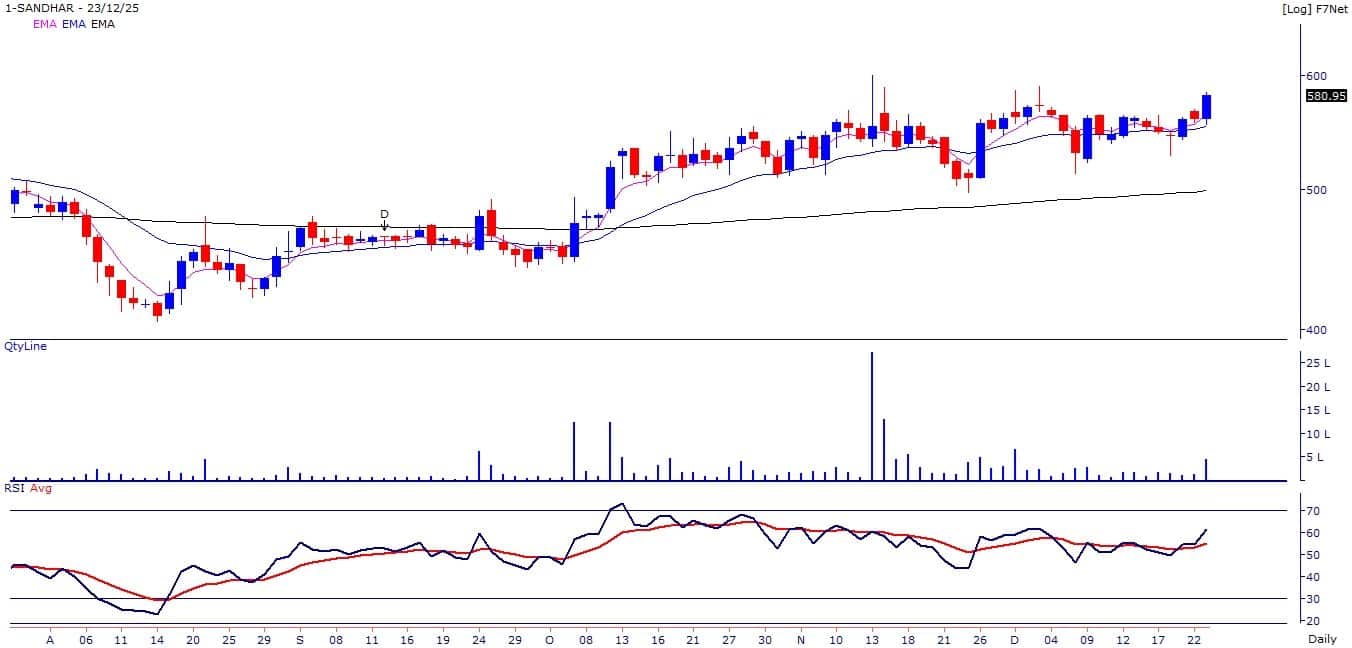
Sandhar’s price has broken out on the daily chart with higher volumes to close at a new 52-week high. The stock price has also broken out from a downward-sloping trendline on the weekly chart.
Momentum indicators and oscillators are in a rising mode and are placed above 60 on the daily chart, indicating strength in the uptrend.
Strategy: Buy
Target: Rs 620, Rs 645
Stop-Loss: Rs 550
Ashish Kyal, CMT, Founder and CEO of Waves Strategy Advisors
Affle 3i | CMP: Rs 1,766
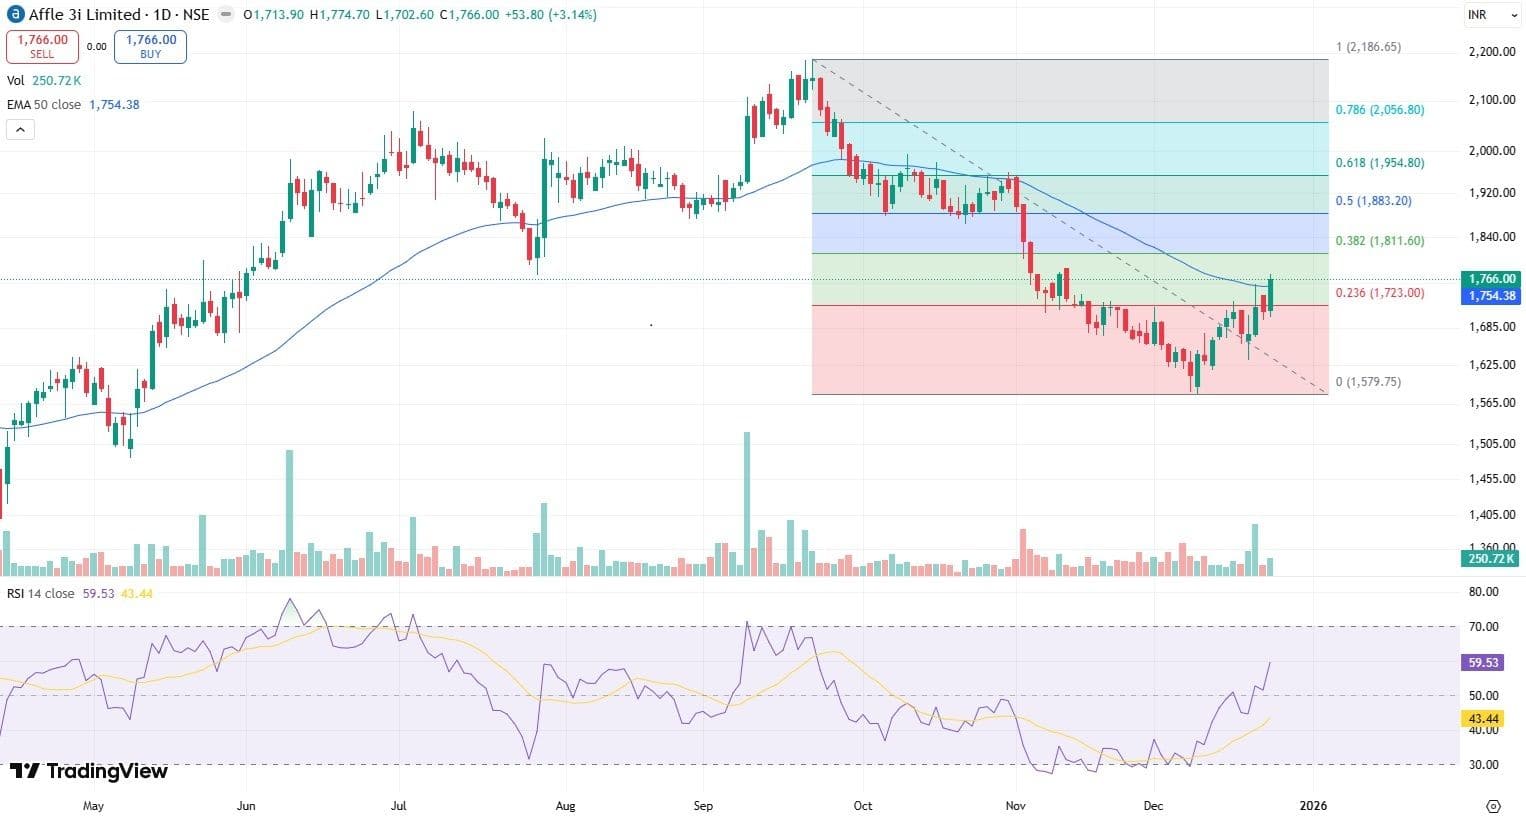
In the previous session, Affle 3i gained more than 3% and delivered a breakout from its downward-sloping channel on the daily chart. Additionally, prices have closed above the 50-day Exponential Moving Average, with an improving RSI acting as a double confirmation of a trend shift.
The recent pullback has already retraced over 23.6% of the entire decline that began in September 2025. The next levels to watch are Rs 1,815 and Rs 1,885, which represent the 38.2% and 50% retracement levels of the fall, respectively. For now, a break above Rs 1,775 is required for bullish momentum to continue, with targets of Rs 1,885. On the downside, Rs 1,720 remains the key support level.
Strategy: Buy
Target: Rs 1,885
Stop-Loss: Rs 1,720
360 ONE WAM | CMP: Rs 1,181.7
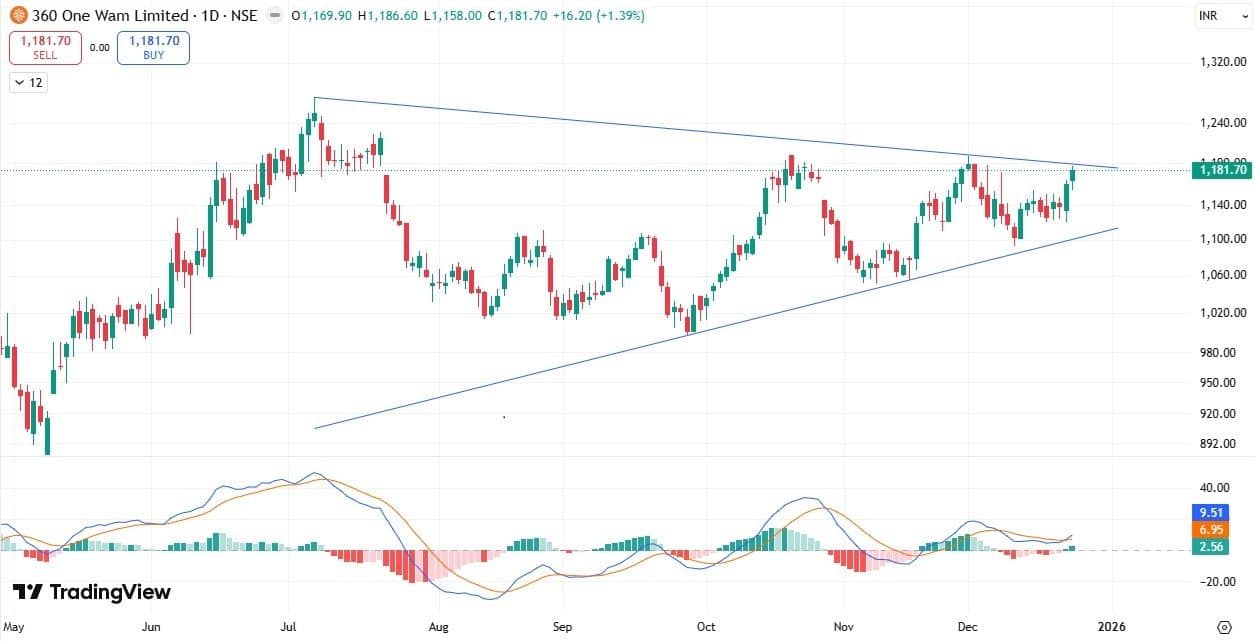
On the daily chart, 360 ONE WAM has been trading within a triangle pattern since July 7, indicating a consolidation phase ahead of a potential breakout. The stock is now on the verge of breaking out of the pattern.
Since December 18, prices have consistently protected the prior day’s low on a closing basis, reflecting sustained buying interest. The formation of higher highs and higher lows further strengthens the bullish setup.
Additionally, the MACD indicator has given a bullish crossover, with green histograms forming above the zero line, signaling improving momentum. For now, a break above Rs 1,200 can result in a fresh course of rally towards Rs 1,300, as long as Rs 1,150 remains protected on the downside.
Strategy: Buy
Target: Rs 1,300
Stop-Loss: Rs 1,150
UPL | CMP: Rs 781
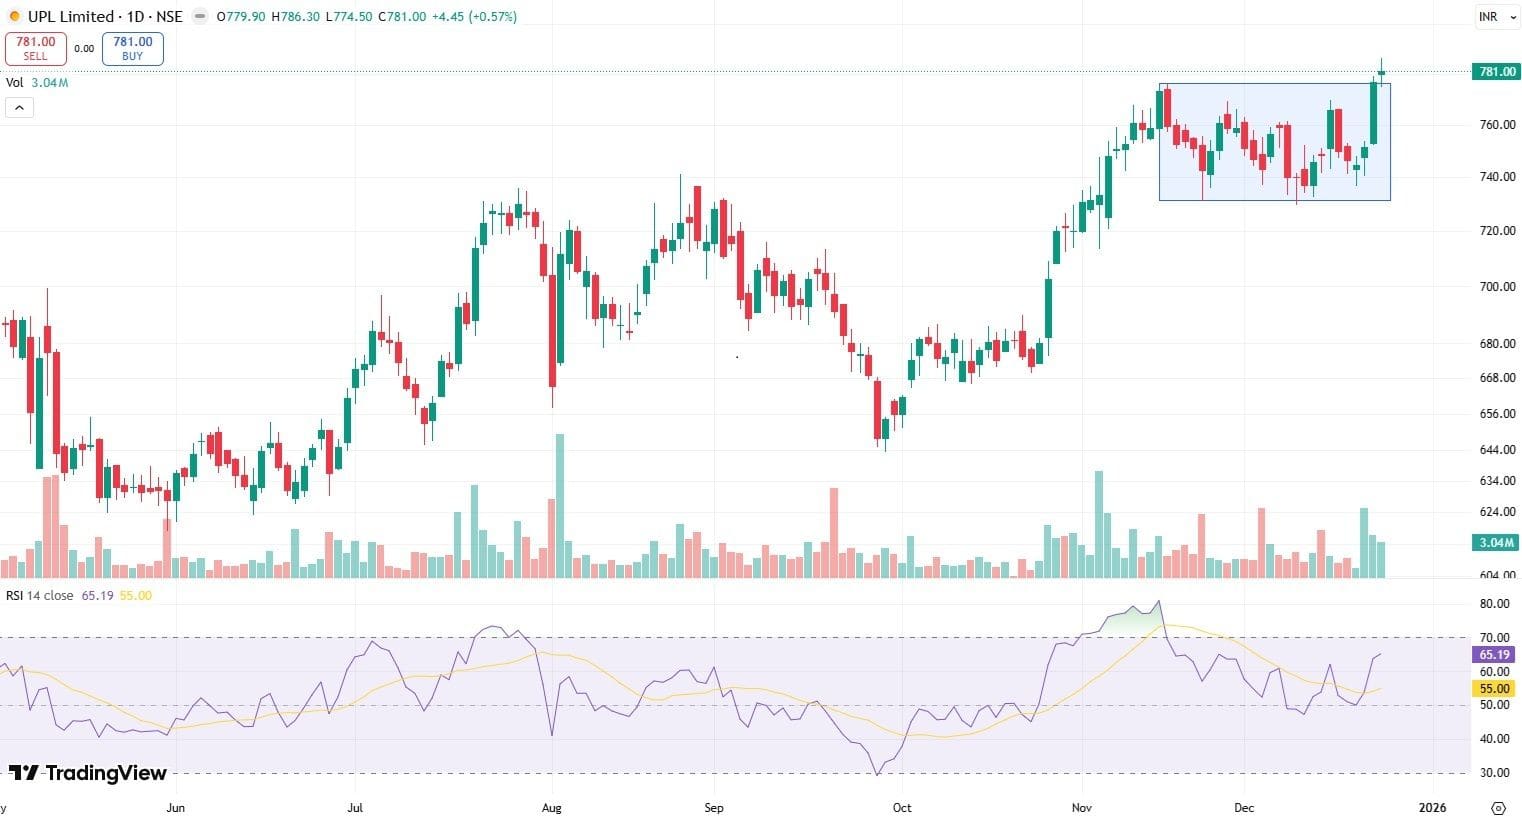
On the daily chart, UPL has been trading in a broad consolidation range of Rs 730–775 over the past month, indicating a phase of accumulation. In the previous session, the stock confirmed a breakout by closing decisively above the Rs 775 resistance, supported by a strong surge in volumes, which is a positive sign.
Also, the RSI is moving above the 60 mark, suggesting strengthening bullish momentum and sufficient room for further upside. For now, dips towards the Rs 775 level can be used as a buying opportunity for a move towards Rs 810, followed by Rs 840. On the downside, the Rs 745 level is expected to act as immediate support.
Strategy: Buy
Target: Rs 810, Rs 840
Stop-Loss: Rs 745
Disclaimer: The views and investment tips expressed by experts on Moneycontrol are their own and not those of the website or its management. Moneycontrol advises users to check with certified experts before taking any investment decisions.Discover the latest Business News, Sensex, and Nifty updates. Obtain Personal Finance insights, tax queries, and expert opinions on Moneycontrol or download the Moneycontrol App to stay updated!
Find the best of Al News in one place, specially curated for you every weekend.
Stay on top of the latest tech trends and biggest startup news.


