


The benchmark indices snapped a three-day winning streak, with the Nifty 50 falling over half a percent on February 5. Market breadth turned negative, with about 1,946 shares declining against 964 advancing on the NSE. The market may consolidate further as participants await the outcome of the RBI monetary policy meeting scheduled for February 6. Below are some short-term trading ideas to consider:
Om Mehra, Technical Research Analyst at Samco Securities
Karnataka Bank | CMP: Rs 199.96
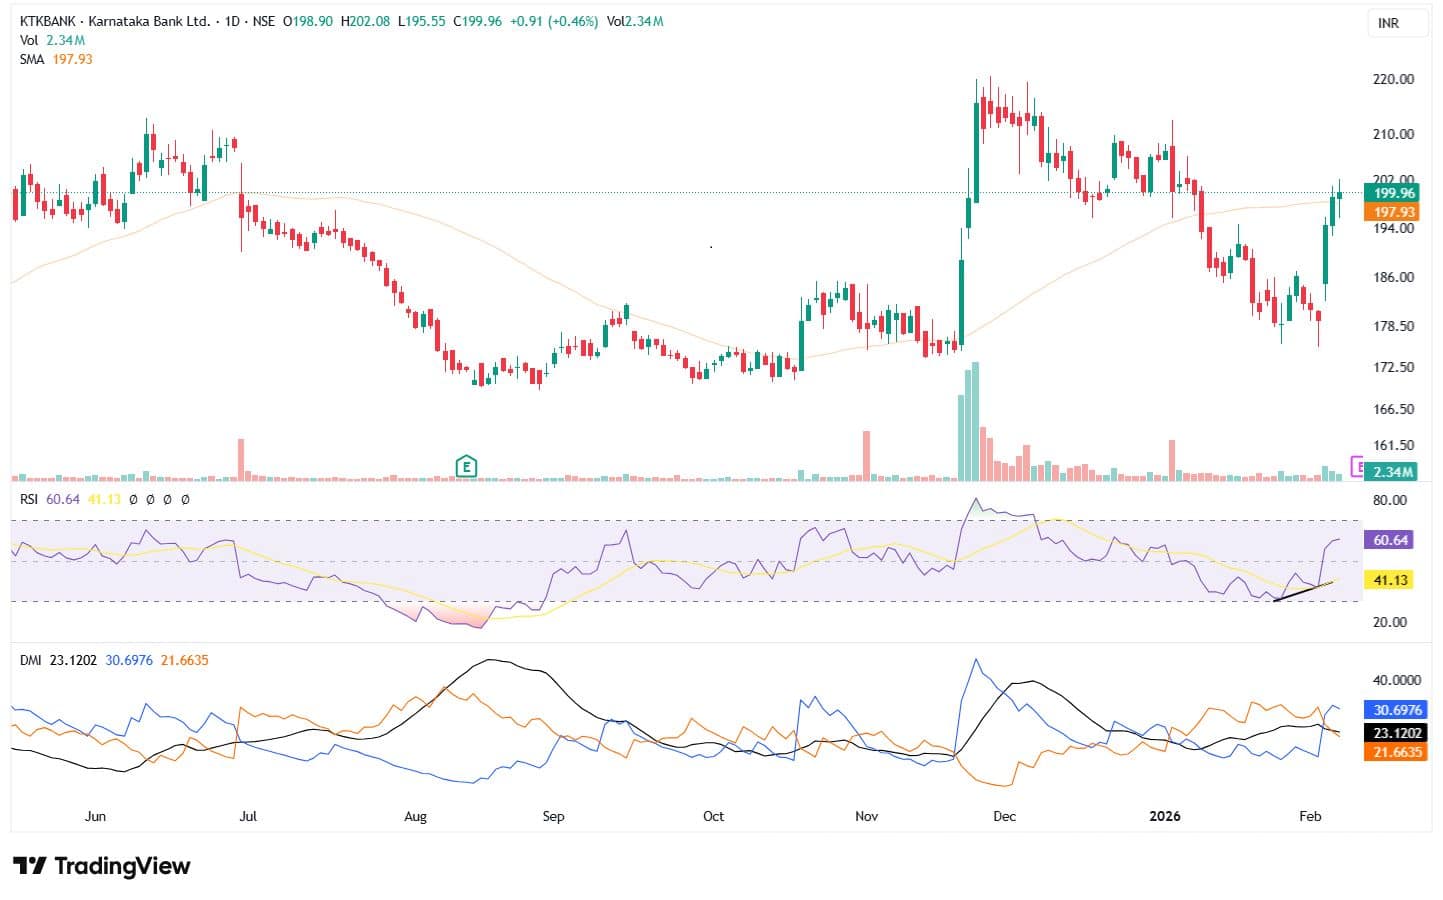
Karnataka Bank has recovered sharply from the recent decline and is now attempting to stabilise above the Rs 195–198 zone on the daily chart. The stock has reclaimed its short-term moving average near Rs 198 and is gradually moving higher after forming a higher low during the recent corrective phase. The recovery candle reflects improving acceptance at higher levels.
The daily RSI is placed near 60 and has turned higher from lower levels, indicating a revival in momentum. The DMI setup shows the positive directional line above the negative line, while the ADX remains moderate, suggesting that the trend is improving but not yet aggressive. As long as the stock holds above Rs 195, the near-term outlook remains steady.
Strategy: Buy
Target: Rs 215
Stop-Loss: Rs 192
Torrent Power | CMP: Rs 1,417.60
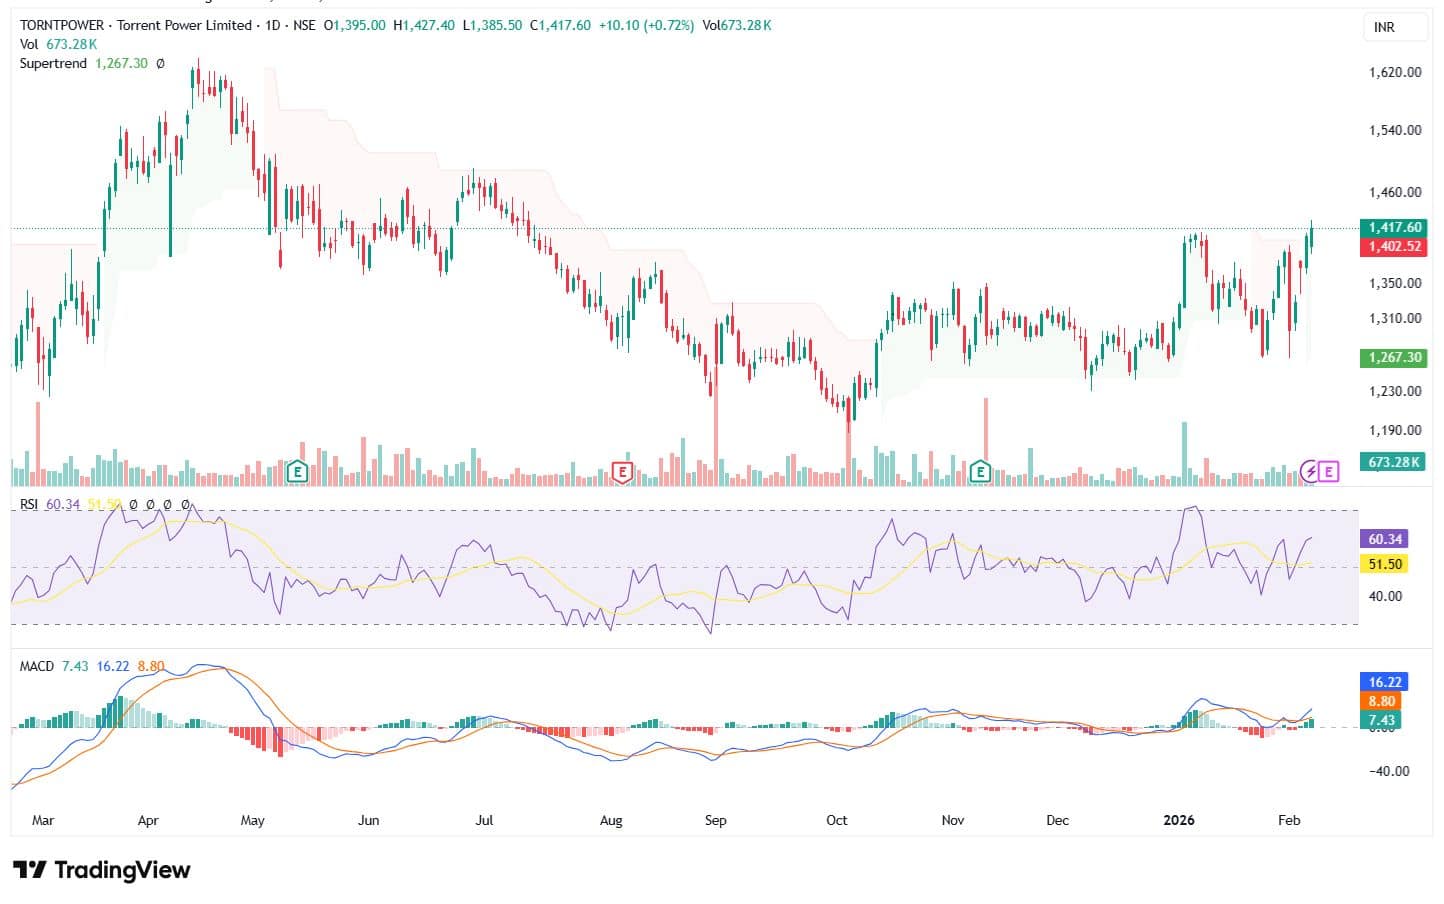
Torrent Power has retained bullish momentum and is now trading near the higher end of the recent range on the daily chart. The stock is holding comfortably above the rising Supertrend support near Rs 1,265, which continues to provide a strong base on declines. A cup-and-handle formation is also emerging on the daily chart.
The daily RSI is placed near 60, indicating steady momentum. The MACD remains in positive territory, with a gradual improvement in the histogram, suggesting continuation rather than sharp acceleration. Volumes have remained steady during the advance, supporting the ongoing momentum. As long as the stock holds above its support zone at Rs 1,375, the near-term outlook remains positive.
Strategy: Buy
Target: Rs 1,500
Stop-Loss: Rs 1,360
NHPC | CMP: Rs 80
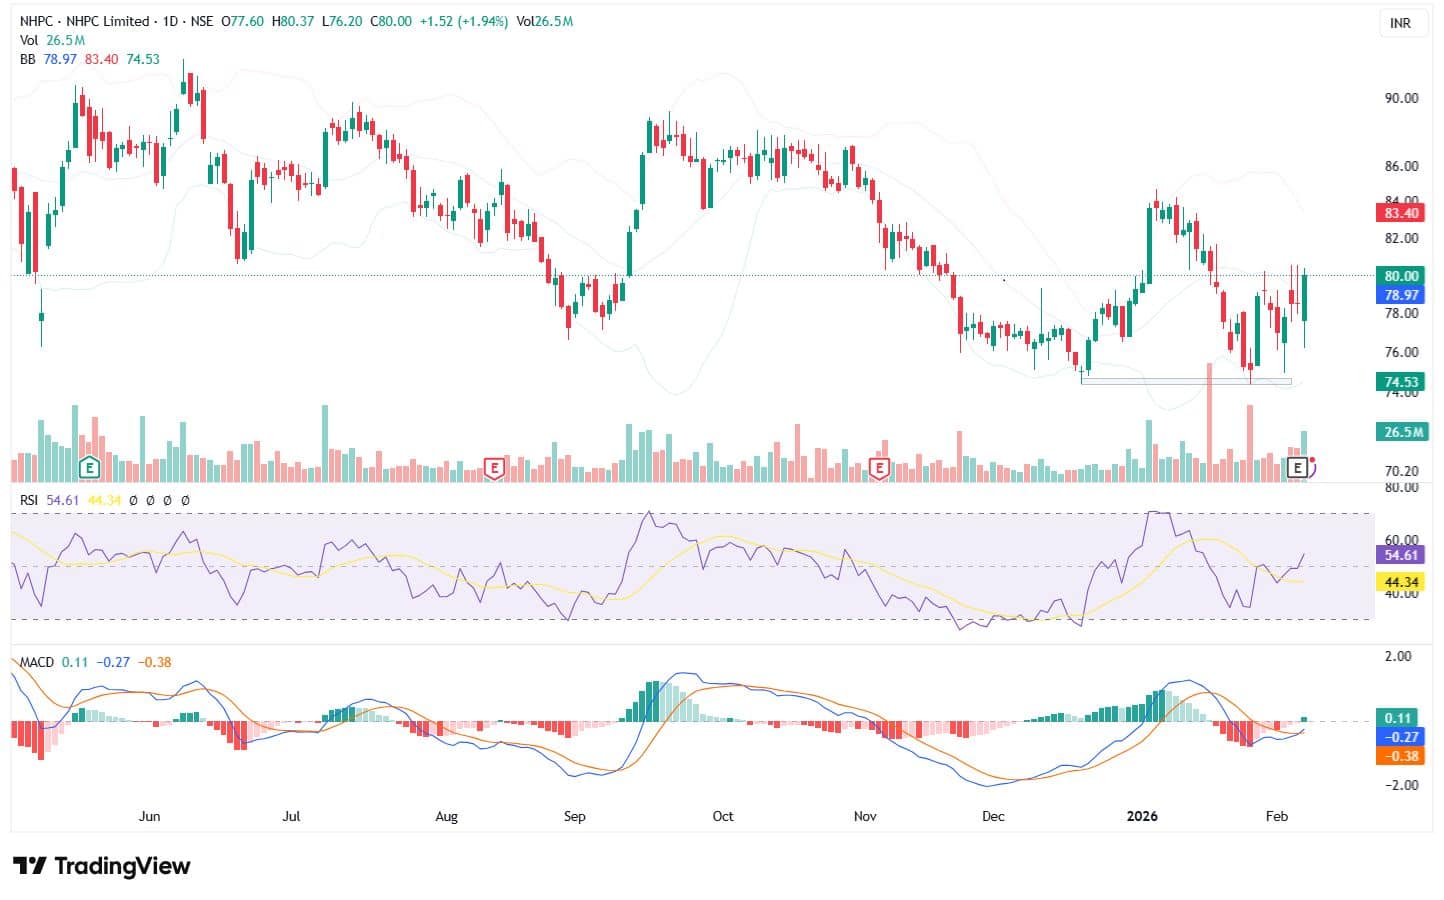
NHPC has formed a clear double bottom near the Rs 74–75 zone on the daily chart and is now attempting to move higher from this base. The recent recovery has resulted in a higher high, indicating a shift in the short-term trend after the prior decline. The stock is trading close to the mid-Bollinger Band, suggesting improving momentum following the base formation.
The daily RSI is placed near 55 and is trending higher. The MACD is hovering near the zero line. Volumes have picked up around the base area, supporting the pattern. As long as NHPC holds above Rs 77, the near-term outlook remains steady.
Strategy: Buy
Target: Rs 87
Stop-Loss: Rs 75
Aakash Shah, Research Analyst at Choice Broking
IFCI | CMP: Rs 60
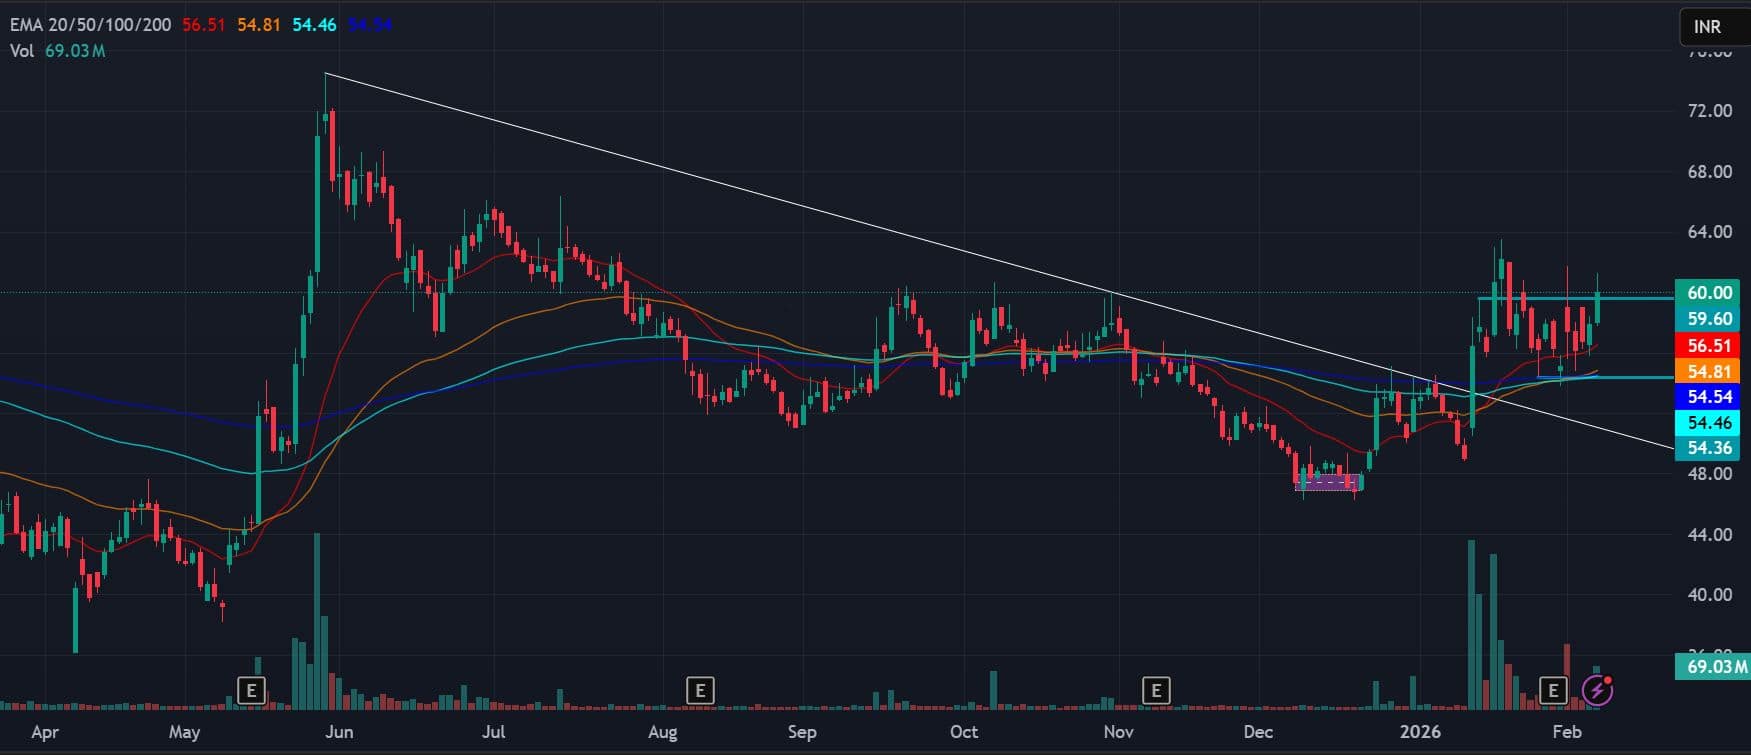
IFCI has witnessed a decisive breakout from a prolonged descending trendline on the daily chart, signalling a potential shift in trend from consolidation to a bullish bias. The recent strong bullish candle, supported by a pickup in volumes, confirms renewed buying interest and improving momentum.
The stock is currently trading around Rs 60 and is holding above the 20 EMA and 50 EMA, reflecting a strengthening short-term trend structure. The positive alignment of short-term moving averages suggests improving price acceptance at higher levels and supports continuation attempts.
Structurally, the recent higher-low formation and trendline breakout point toward a shift from distribution to accumulation. The zone around Rs 57 now acts as an important near-term demand area, and as long as the price sustains above this region, the bullish structure remains intact.
Strategy: Buy
Target: Rs 66
Stop-Loss: Rs 57
Gujarat Mineral Development Corporation | CMP: Rs 613.85
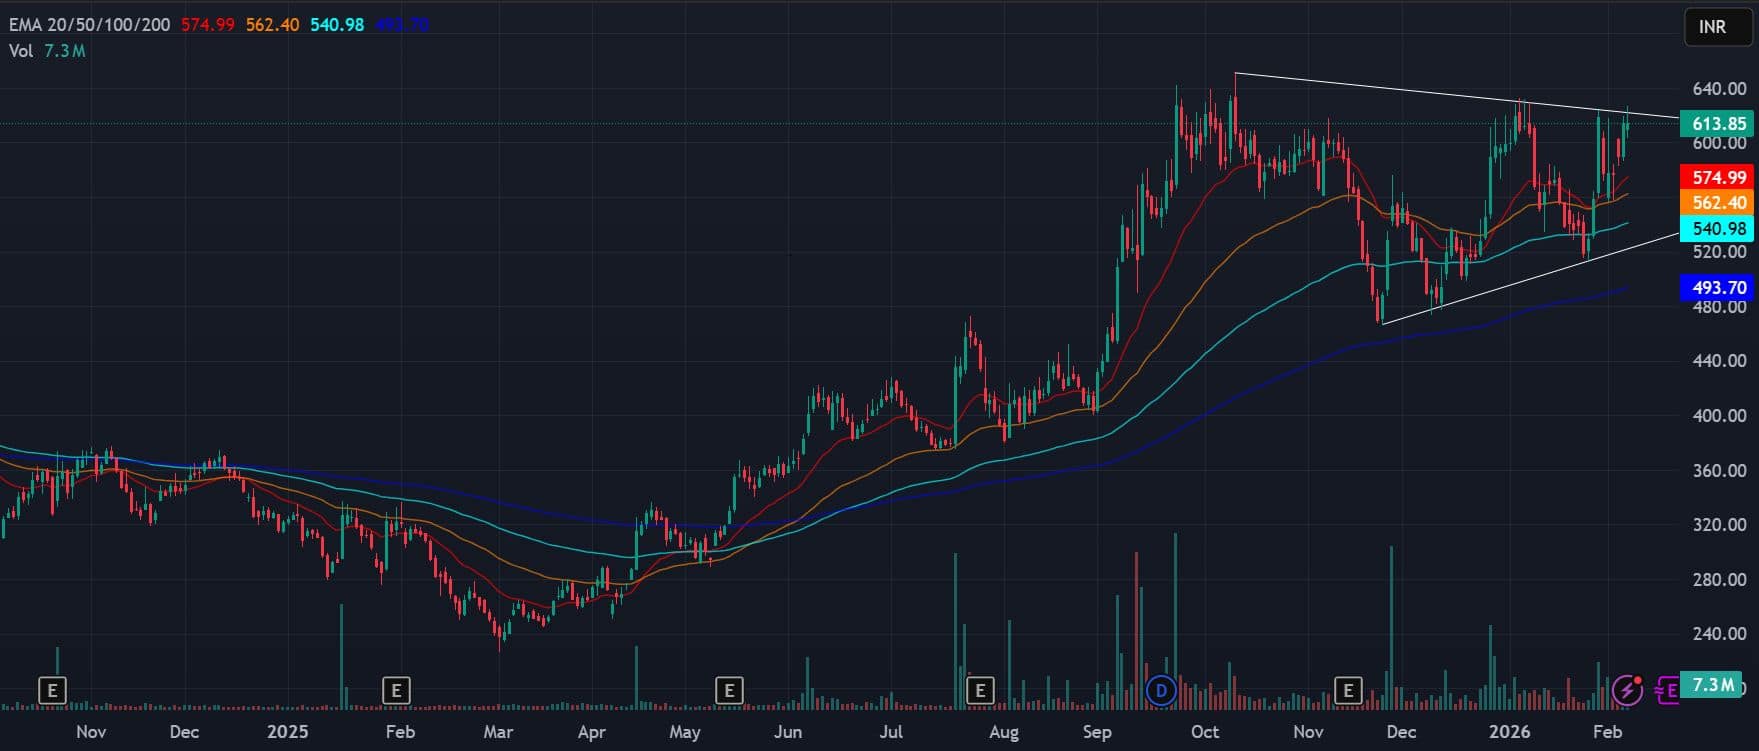
GMDC is currently trading within a well-defined symmetrical triangle pattern on the daily chart, indicating a phase of contraction and consolidation after a strong prior uptrend. This pattern reflects a balance between buyers and sellers and often precedes a directional expansion in volatility.
The stock continues to trade above the 20 EMA, 50 EMA, and 100 EMA, highlighting that the broader trend remains positive despite the ongoing consolidation. The rising long-term structure, supported by the 200 EMA positioned well below current levels, suggests that this triangle is forming as a continuation pattern rather than a trend reversal.
The contracting range marked by lower highs and higher lows shows healthy price compression, which typically leads to a strong breakout move. A decisive close above the upper trendline of the triangle, supported by volume expansion, would confirm bullish continuation and open the door for a move toward the Rs 650–660 resistance zone. On the downside, the lower trendline and EMA cluster around the Rs 585–595 zone act as a critical support area.
Strategy: Buy
Target: Rs 660
Stop-Loss: Rs 585
JSW Energy | CMP: Rs 473.95
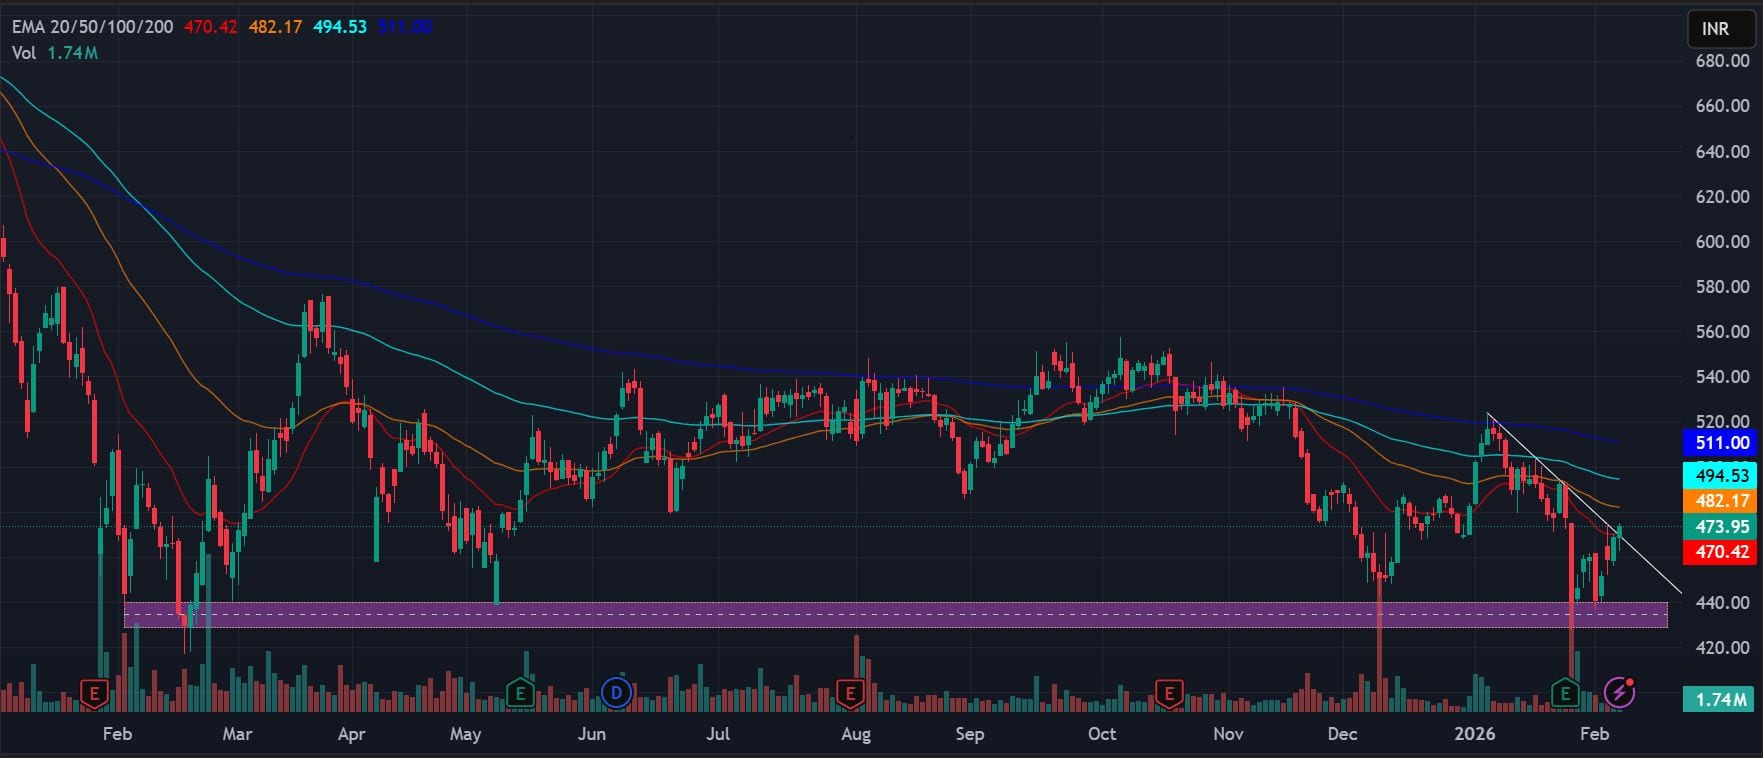
JSW Energy is showing early signs of a trend reversal attempt after a prolonged corrective phase. The stock has rebounded strongly from a well-defined demand zone around Rs 430–440, indicating the presence of strong buying interest at lower levels.
The price has moved back above the 20 EMA and is attempting to reclaim the 50 EMA, suggesting improving short-term momentum. Although the stock is still trading below the 100 EMA and 200 EMA, the recent higher-low formation points toward a gradual shift in structure.
The breakout from the short-term falling trendline reflects weakening bearish pressure and the possibility of a base formation. Follow-through buying above current levels would further validate the reversal attempt.
Structurally, the demand zone near Rs 445–450 remains a key support area. Holding above this zone keeps the reversal structure intact and opens the door for a recovery toward the Rs 515 resistance zone.
Strategy: Buy
Target: Rs 515
Stop-Loss: Rs 450
Jay Mehta, Technical Research at JM Financial Services
Chennai Petroleum Corporation | CMP: Rs 894.4
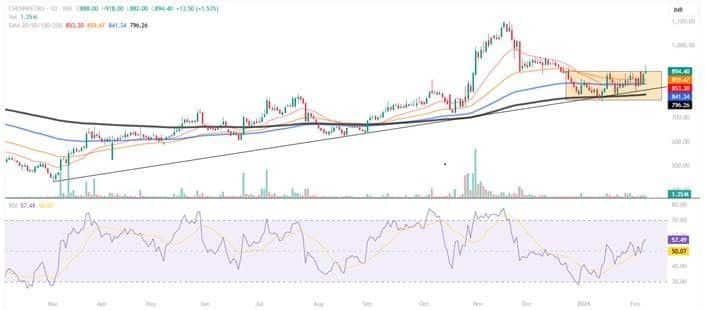
Chennai Petroleum Corporation formed a solid base near trendline support aligned with the 200-day EMA and consolidated for over a month. In the latest session, it attempted a breakout above the range and closed marginally above it. The RSI is developing a bullish structure and is trading above 50. The price is positioned above key EMAs, with all averages sloping upward. Further momentum may emerge once the previous session’s high is breached.
Strategy: Buy
Target: Rs 982, Rs 1,020
Stop-Loss: Rs 830
Ajanta Pharma | CMP: Rs 2,817.3
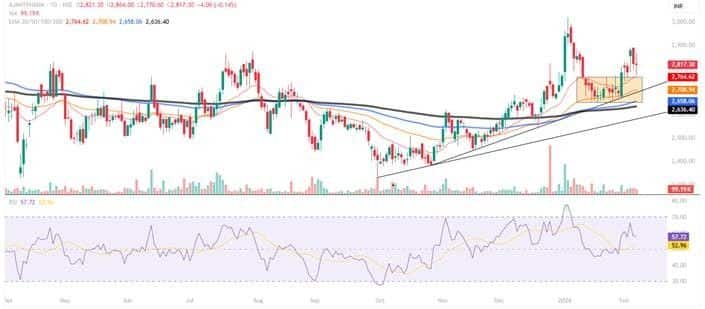
Ajanta Pharma built a base near trendline support aligned with the 50-day EMA and consolidated for more than three weeks. On January 30, the stock broke out above the range on a strong bullish candle.
The price now trades above key EMAs with upward slopes. Momentum indicators are in bullish territory on both daily and weekly charts. The latest session shows the price retesting the breakout zone and finding support around the 20-day EMA.
Strategy: Buy
Target: Rs 3,050, Rs 3,150
Stop-Loss: Rs 2,675
Supreme Industries | CMP: Rs 3,740.9
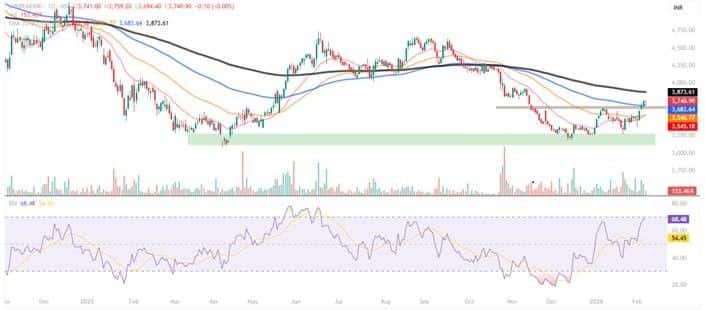
Supreme Industries is bouncing strongly from a long-term base, forming a bullish consolidation pattern. The stock delivered a decisive breakout above the pattern three sessions ago, accompanied by a bullish gap-up near the breakout level.
The price has reclaimed short- and medium-term EMAs, with averages sloping upward. Volumes are building positively on up days, confirming accumulation. Momentum indicators support the continuation of bullish momentum, and the structure remains favourable for buyers as long as the breakout zone holds.
Strategy: Buy
Target: Rs 3,940, Rs 4,120
Stop-Loss: Rs 3,400
Disclaimer: The views and investment tips expressed by experts on Moneycontrol are their own and not those of the website or its management. Moneycontrol advises users to check with certified experts before taking any investment decisions.Discover the latest Business News, Sensex, and Nifty updates. Obtain Personal Finance insights, tax queries, and expert opinions on Moneycontrol or download the Moneycontrol App to stay updated!
Find the best of Al News in one place, specially curated for you every weekend.
Stay on top of the latest tech trends and biggest startup news.


