


The benchmark indices rebounded with a half-percent rally on January 22, with market breadth turning positive. About 2,176 shares advanced against 740 declining shares on the NSE. The market is expected to consolidate with range-bound trading as long as it trades below the current week’s high. Below are some short-term trading ideas to consider:
Jay Mehta, Technical Research at JM Financial Services
Ipca Laboratories | CMP: Rs 1,485.6
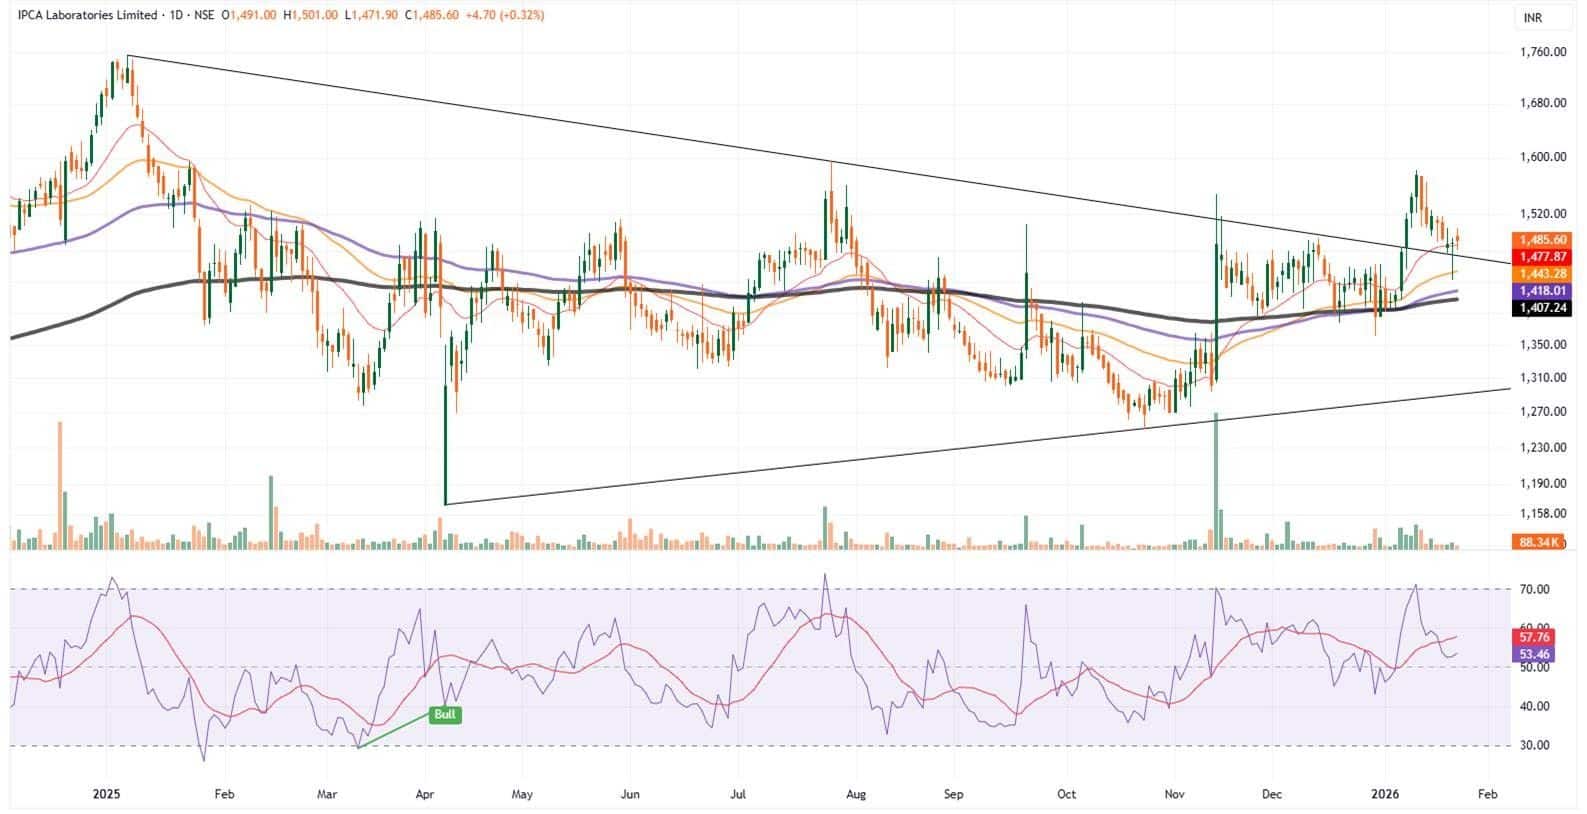
Ipca Laboratories broke out from a prolonged triangular consolidation between January 2 and 9 with a 13.6 percent rally, while broader indices corrected around 2.5 percent, highlighting superior relative strength. The breakout was supported by robust volume participation.
Currently retesting the breakout zone, the stock formed a strong dragonfly doji, signalling that the throwback is likely complete and upside resumption is imminent. Momentum studies favour a bullish bias. However, the price remains below short-, medium-, and long-term moving averages.
Strategy: Buy
Target: Rs 1,680, Rs 1,733
Stop-Loss: Rs 1,380
One 97 Communications Paytm | CMP: Rs 1,260.5
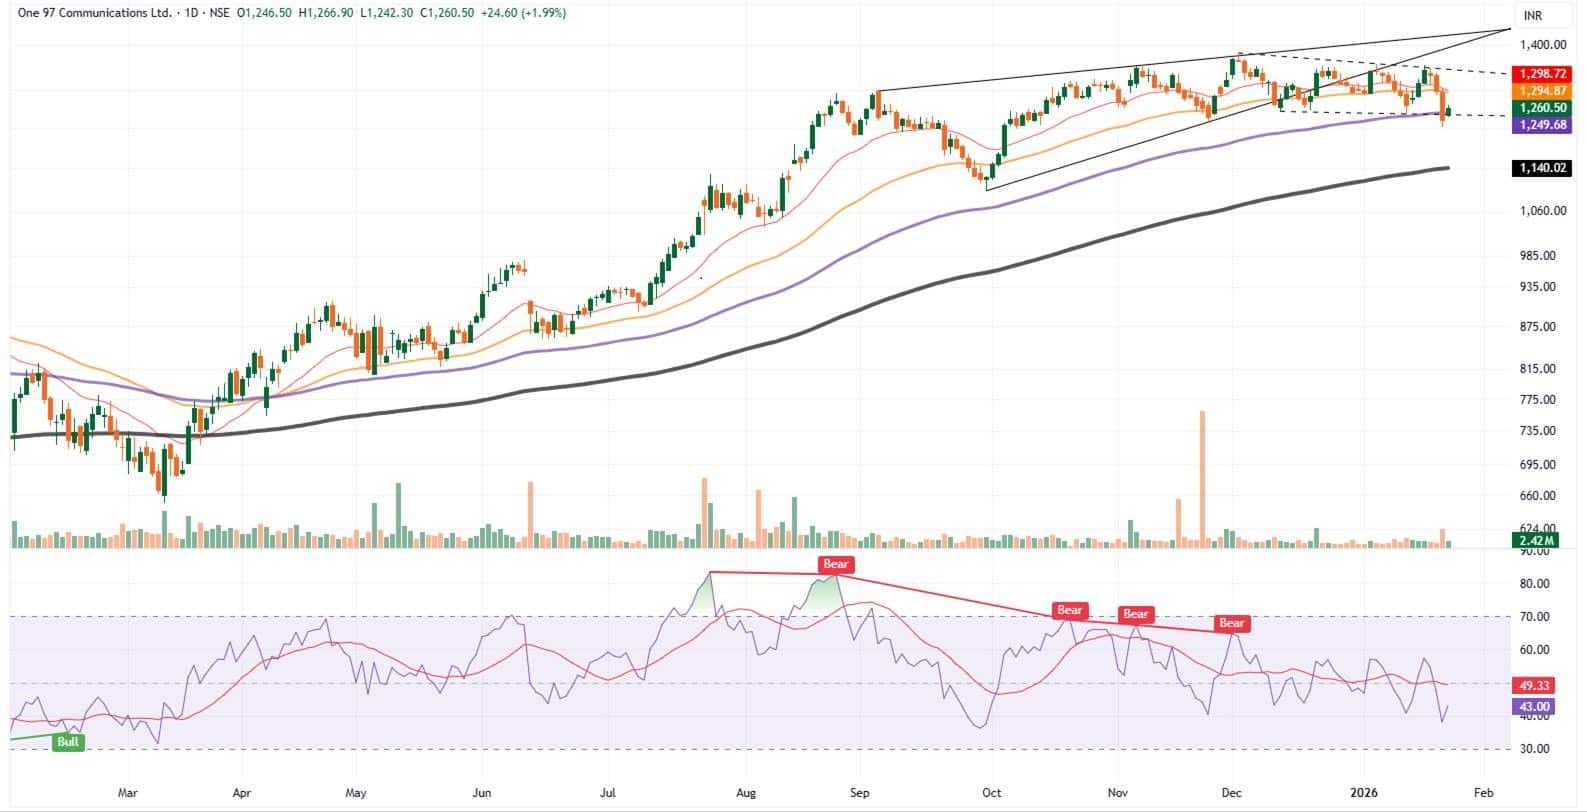
Paytm was confined to a long-term bearish wedge consolidation. It broke down from the pattern a few days ago, but follow-through selling was absent, leading to sideways action with lower highs and lower lows. Wednesday delivered a decisive breakdown below the consolidation range on a strong bearish candle backed by heavy volume.
Momentum studies show multiple bearish divergences, with indicators failing to make new highs. The price trades below short- and medium-term moving averages, and trend indicators point to a continued negative bias. Initiate shorts at current levels and add shorts on rises up to Rs 1,295.
Strategy: Sell
Target: Rs 1,145, Rs 1,118
Stop-Loss: Rs 1,368
Amber Enterprises India | CMP: Rs 5,732
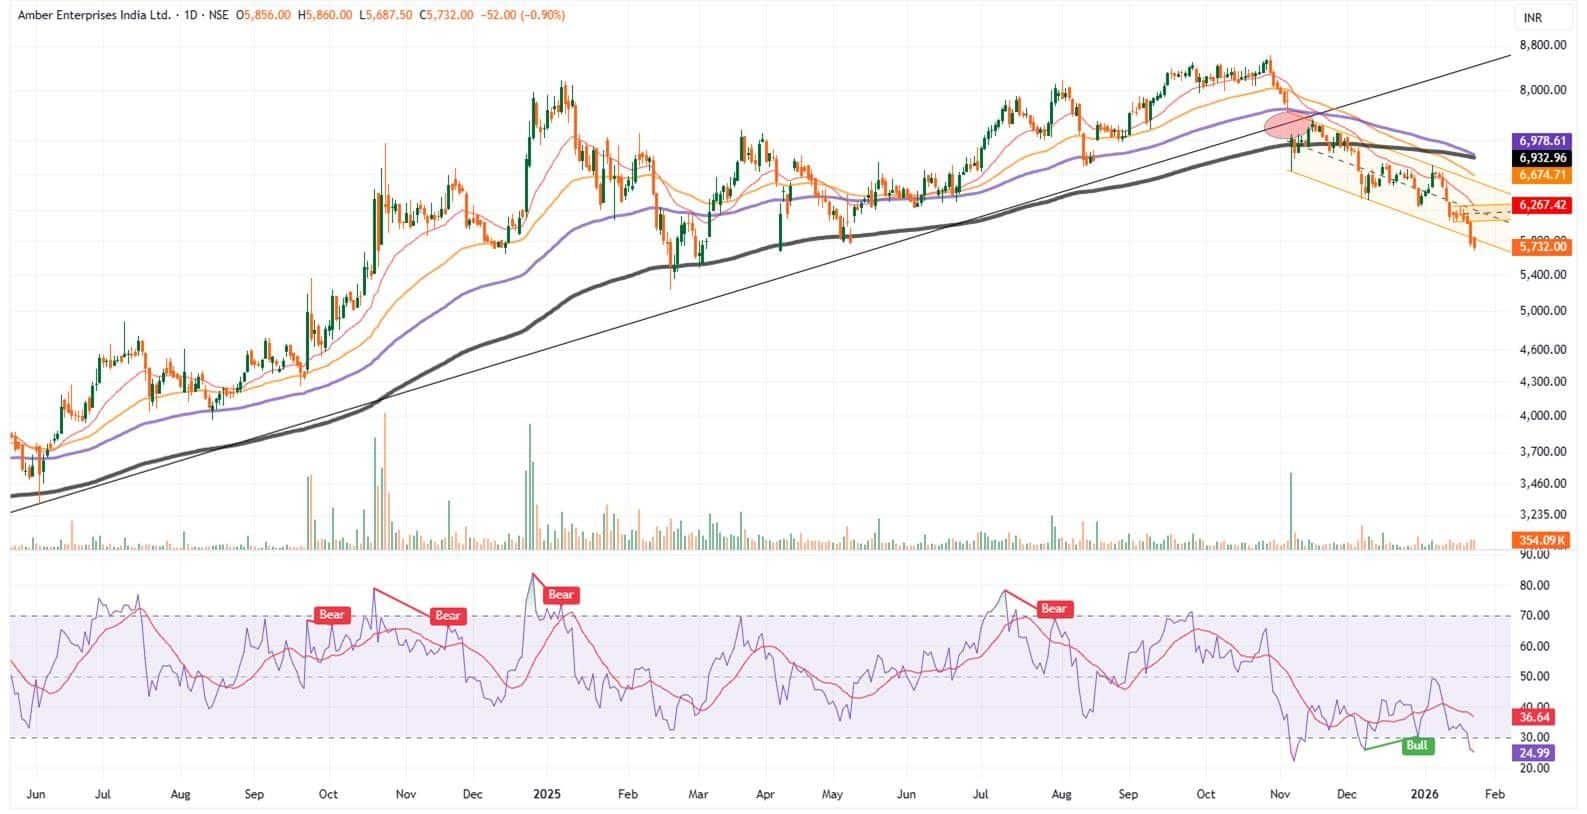
Amber Enterprises broke down from a rising trendline active since May 2023 on a strong bearish gap-down with heavy volume, indicating a significant supply shift. Since then, it has maintained a downtrend with lower highs and lower lows inside a sloping channel. Wednesday confirmed a breakdown below the channel.
The price trades well below medium- and long-term moving averages. On shorter timeframes, it broke down from a bearish flag-and-pole pattern, suggesting potential for accelerated downside momentum. Sell at CMP and add shorts on rises up to Rs 5,950.
Strategy: Sell
Target: Rs 5,250, Rs 5,090
Stop-Loss: Rs 6,326
Om Mehra, Technical Research Analyst at Samco Securities
Steel Authority of India | CMP: Rs 151.65
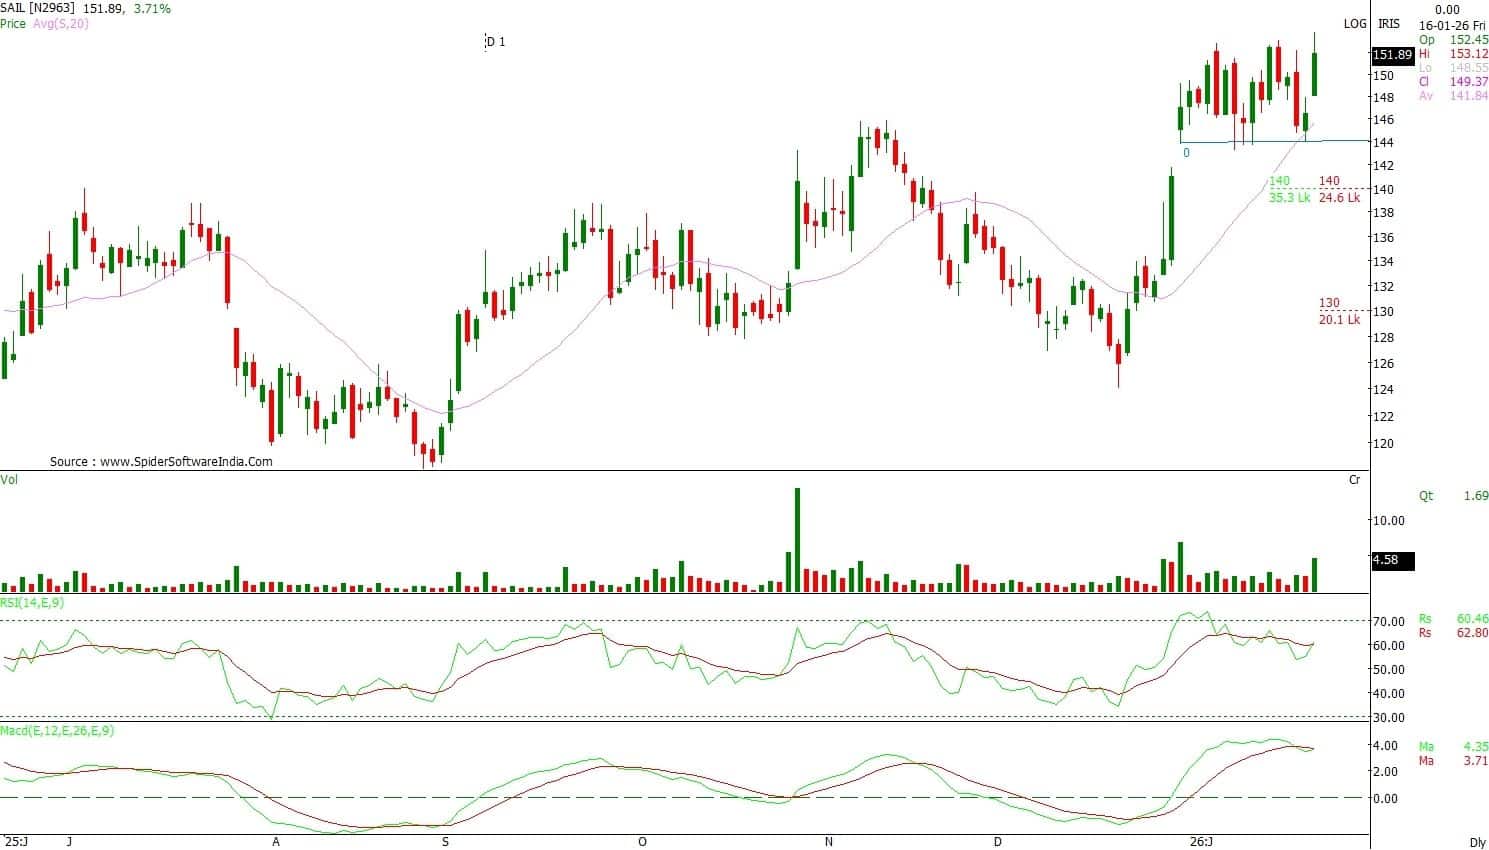
SAIL has resumed its upward trajectory after a brief consolidation and is now holding above the Rs 150 level, which had earlier acted as a minor hurdle. The stock is trading comfortably above its short-term moving averages and is respecting the rising VWAP (volume-weighted average price), which has acted as a reliable support during recent pullbacks. The stock is stabilising above the mid-Bollinger band and is attempting to move back toward the upper range.
The daily RSI is placed near 61, indicating sustained strength. The MACD continues to remain in positive territory, although momentum has moderated slightly. Volumes have improved during the recent up move, reflecting renewed participation after the pullback. The near-term outlook remains favourable as long as the stock holds above the Rs 146 support area. A sustained move above the Rs 154 level could open the path for further upside.
Strategy: Buy
Target: Rs 165
Stop-Loss: Rs 144
Jammu and Kashmir Bank | CMP: Rs 107.09
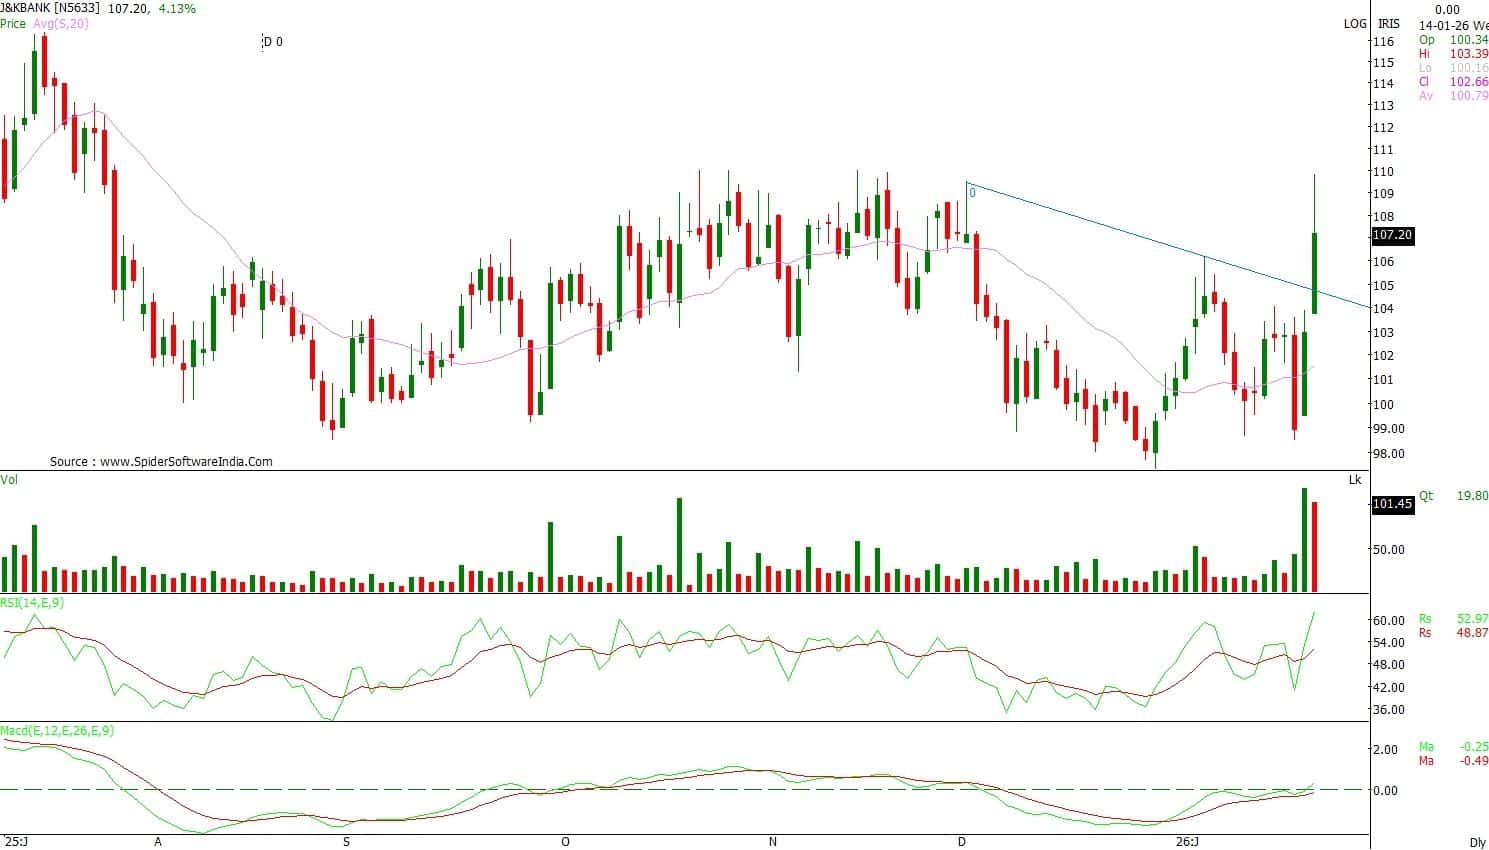
J&K Bank has witnessed a sharp revival after a brief corrective phase and is now trading firmly above the Rs 105–106 zone, which had earlier acted as immediate resistance. The stock has maintained its position above all key moving averages, reflecting a strong rebound. The latest session marked a decisive move higher with an open-low formation, highlighting sustained strength.
The daily RSI is placed near 62 and has moved back into the higher zone, indicating improving momentum. The MACD has turned positive, with the histogram expanding on the upside. Volumes have expanded meaningfully during the breakout. The near-term outlook remains positive as long as the stock holds above the Rs 102–103 zone.
Strategy: Buy
Target: Rs 118
Stop-Loss: Rs 101
Gland Pharma | CMP: Rs 1,723.3
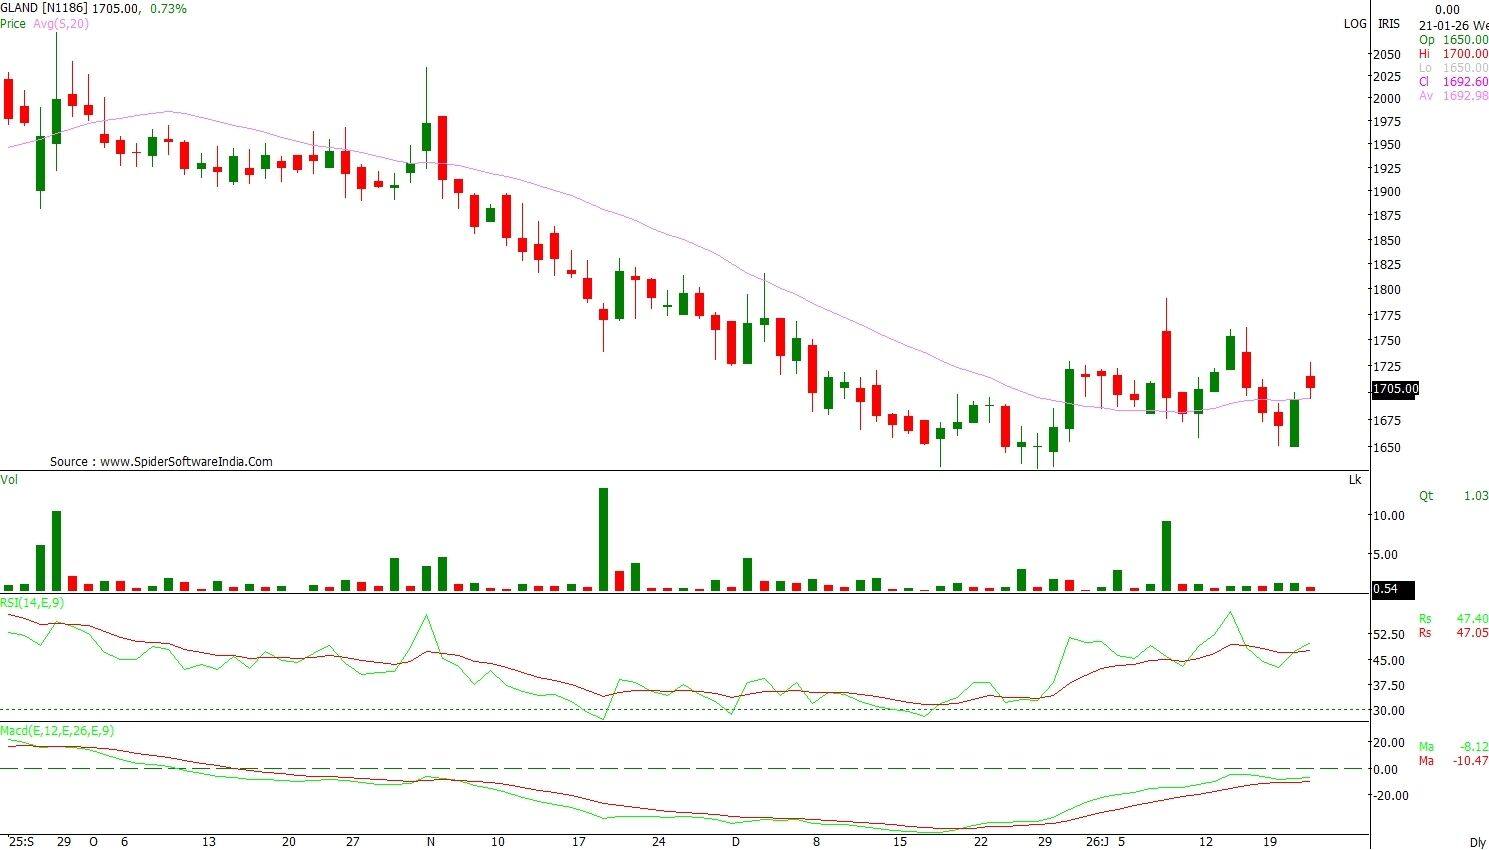
Gland Pharma is showing early signs of stabilisation after a prolonged decline and is now forming a base in the Rs 1,650–1,670 zone. The daily chart indicates a double-bottom formation, with the stock gradually moving higher from recent lows. The stock is trading above the 20-day and 50-day SMAs.
A positive divergence is visible in the daily RSI, which is placed near the 53 level. The MACD remains below the zero line but is trending upward, indicating that the recovery is still in its early phase. Volumes remain on the lower side but have shown slight improvement over the last few sessions, which is typically seen when a stock begins to build a base.
Strategy: Buy
Target: Rs 1,850
Stop-Loss: Rs 1,655
Aakash Shah, Research Analyst at Choice Broking
Indian Bank | CMP: Rs 896.75
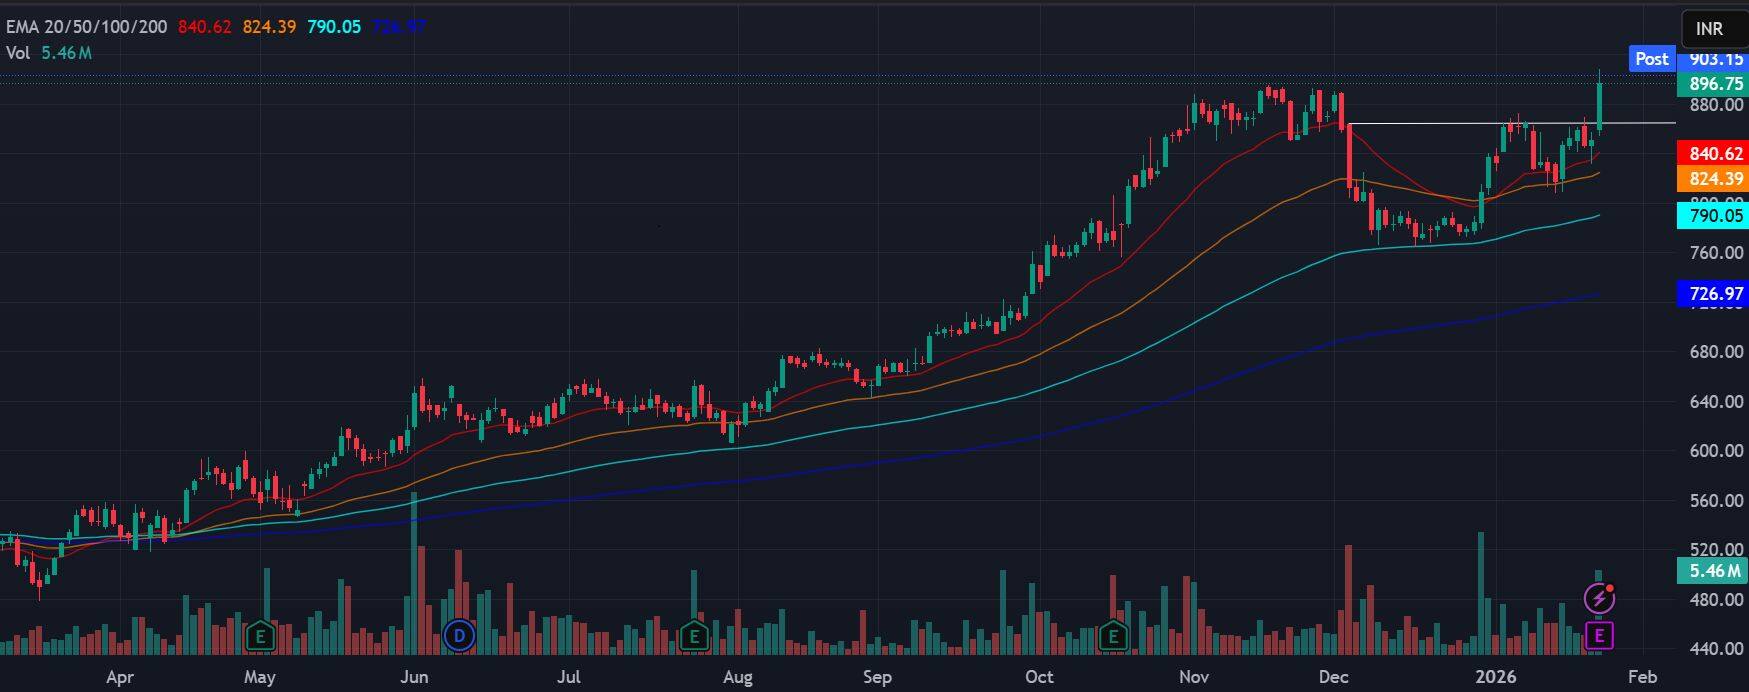
Indian Bank is trading at all-time high levels, highlighting strong bullish dominance and sustained institutional participation. The stock remains in a well-defined uptrend, with price action consistently forming higher highs and higher lows, indicating strength rather than exhaustion.
On the daily chart, the all-time-high breakout indicates strong demand, as there is no overhead supply pressure. The breakout is supported by a strong bullish candle, reflecting confident buying interest.
From a moving-average perspective, the stock is trading well above the key EMAs, all of which are positively aligned and sloping upward. The 20 EMA continues to act as a reliable dynamic support, with every minor pullback being absorbed quickly, reinforcing the strength of the trend.
Structurally, the Rs 855 zone now acts as a strong demand and support area. As long as the price sustains above this region, the bullish structure remains intact.
Strategy: Buy
Target: Rs 950
Stop-Loss: Rs 855
Bharat Electronics | CMP: Rs 417.3
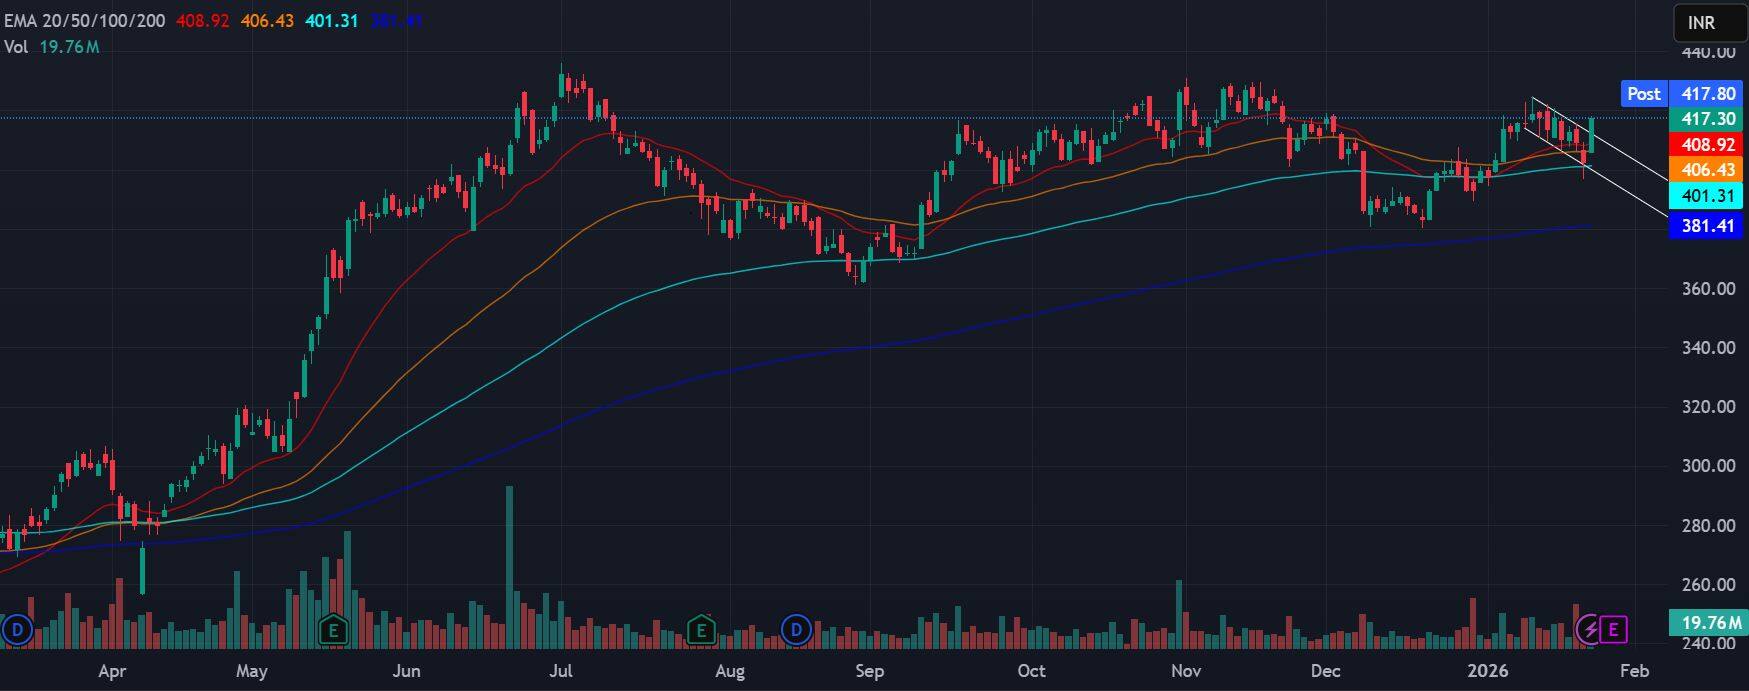
Bharat Electronics is showing signs of a bullish consolidation breakout setup within a broader uptrend. After an extended rally, the stock entered a brief consolidation phase and is now attempting to resume its upward move.
On the daily chart, price action reflects a higher-low structure, with the stock holding above its key moving averages. BEL is trading above the key EMAs, while the 200 EMA continues to trend higher, confirming long-term trend strength. The recent breakout from a short-term falling channel suggests a pause in momentum rather than a trend reversal.
The 20 and 50 EMAs are acting as immediate support, indicating that dips are being bought into. Volume has picked up modestly on the breakout attempt, while selling pressure during consolidation remained muted—a positive sign of accumulation.
Structurally, the Rs 405 zone now acts as a strong support base. Sustained trade above this zone keeps the bullish structure intact and opens the path toward the Rs 440 level in the coming sessions.
Strategy: Buy
Target: Rs 440
Stop-Loss: Rs 405
Godrej Consumer Products | CMP: Rs 1,246
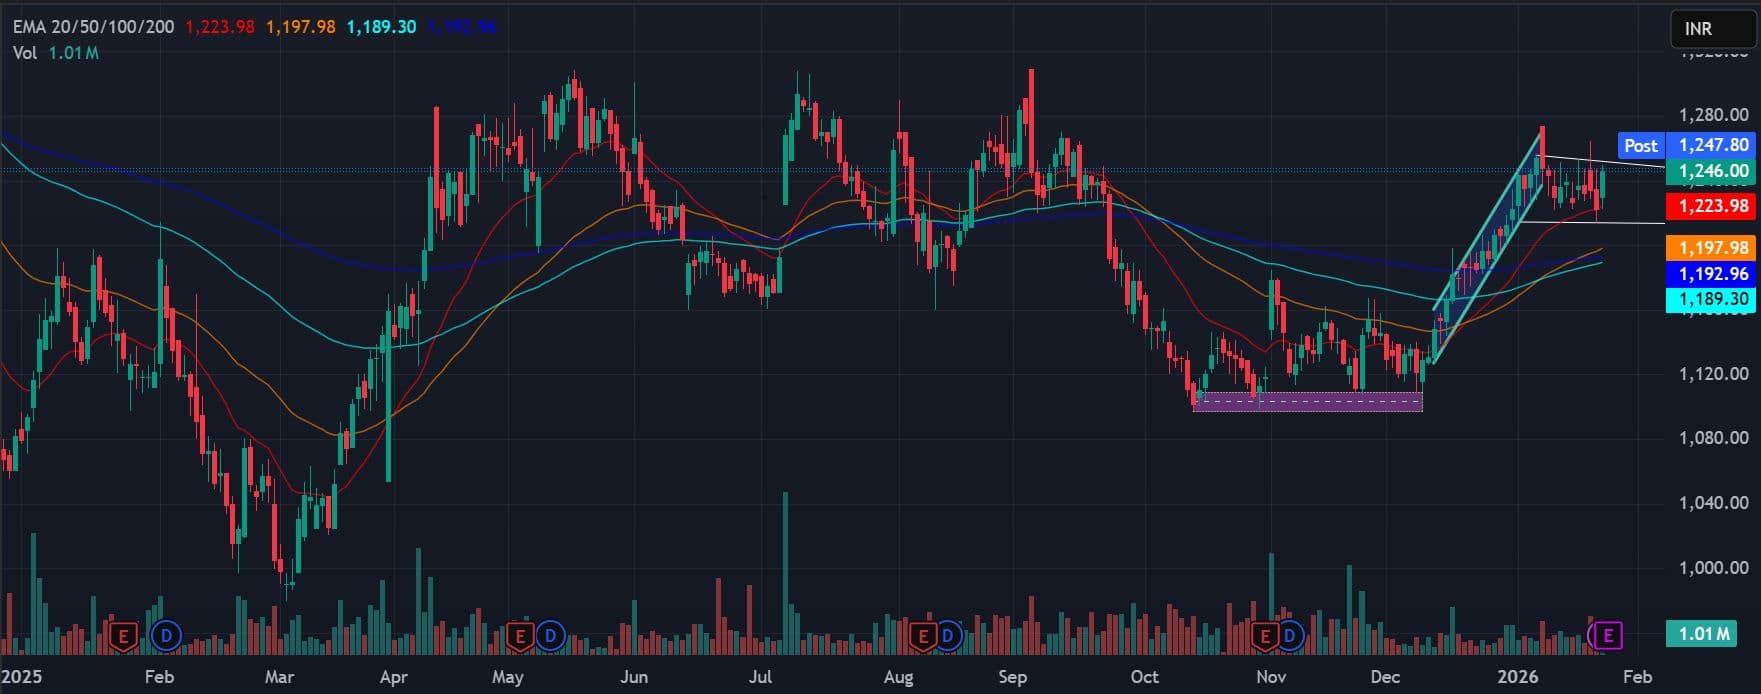
Godrej Consumer Products is displaying a clear trend reversal and breakout structure after a prolonged consolidation and base formation. The stock has transitioned from a sideways-to-bearish phase into a fresh bullish leg. Price action on the daily chart shows a strong breakout from a multi-week base near the Rs 1,100–1,120 zone, followed by a series of higher highs and higher lows.
The stock has decisively reclaimed the 20, 50, and 100 EMAs, with short-term averages turning upward, signalling renewed bullish momentum. Acceptance above the 100 EMA further strengthens the reversal thesis. Volume expansion during the breakout move, combined with relatively lighter volume during the prior consolidation, highlights accumulation behaviour rather than distribution. The sharp bullish impulse leg suggests strong institutional participation.
Strategy: Buy
Target: Rs 1,320
Stop-Loss: Rs 1,200
Disclaimer: The views and investment tips expressed by experts on Moneycontrol are their own and not those of the website or its management. Moneycontrol advises users to check with certified experts before taking any investment decisions.Discover the latest Business News, Sensex, and Nifty updates. Obtain Personal Finance insights, tax queries, and expert opinions on Moneycontrol or download the Moneycontrol App to stay updated!
Find the best of Al News in one place, specially curated for you every weekend.
Stay on top of the latest tech trends and biggest startup news.


