


Equity benchmarks plummeted over 1.2 percent on March 2, continuing the severe fall for another session amid the US-Israel-Iran conflict. Market breadth weakened further, with about 2,501 shares declining against 474 advancing shares on the NSE. The market is likely to reel under bear pressure given the weakening momentum and technical indicators amid the Iran war. Below are some short-term trading ideas to consider:
Jay Thakkar, Head of Derivatives and Quant Research and Vice President at ICICI Securities
Bharat Dynamics | CMP: Rs 1,268
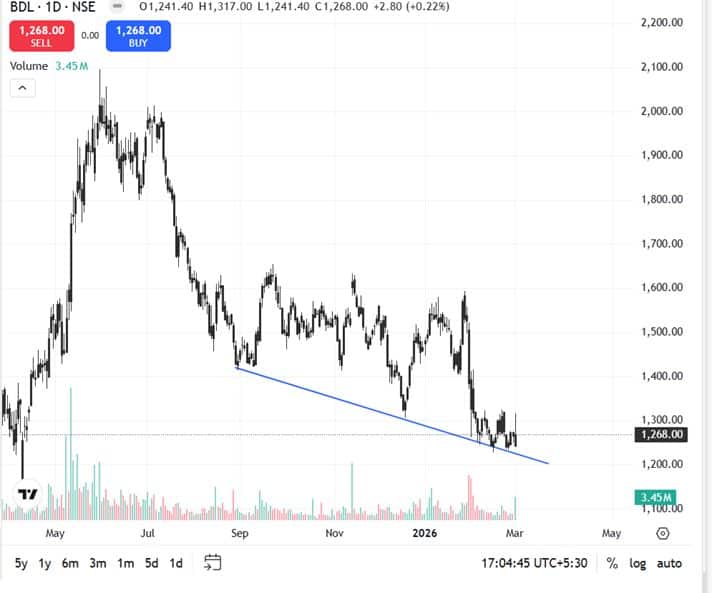
BDL has formed a short-term base near the Rs 1,240 level, where it has taken support on multiple occasions. Along with that, there are signs of some short covering as well in the futures segment.
In the short term, due to geopolitical tensions, there is a higher chance of short covering in this sector; hence, BDL can benefit in the near term. On the upside, the Rs 1,300 strike has the highest Call base, so above those levels one can expect a bounce in the stock due to call unwinding. Buy BDL Futures in the range of Rs 1,260–1,280.
Strategy: Buy
Target: Rs 1,340, Rs 1,400
Stop-Loss: Rs 1,230
Asian Paints | CMP: Rs 2,307.1
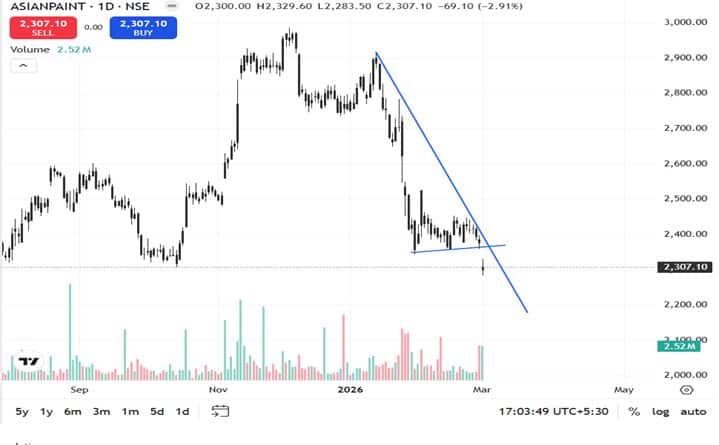
Asian Paints has been forming lower tops and lower bottoms, and along with that, there have been short additions in the stock as well, indicating that the overall trend in the stock is negative and the medium-term trend is weak.
The recent uptrend in crude oil prices due to geopolitical tensions is also negative for the stock; hence, we have a bearish stance on it in the near term. There is a huge Put base at the Rs 2,300 strike, so until that level is held, there can be some consolidation; however, below that, the stock is expected to witness further downside on account of Put unwinding. Sell Asian Paints Futures in the range of Rs 2,320–2,300.
Strategy: Sell
Target: Rs 2,250, Rs 2,200
Stop-Loss: Rs 2,340
Axis Bank | CMP: Rs 1,372.3
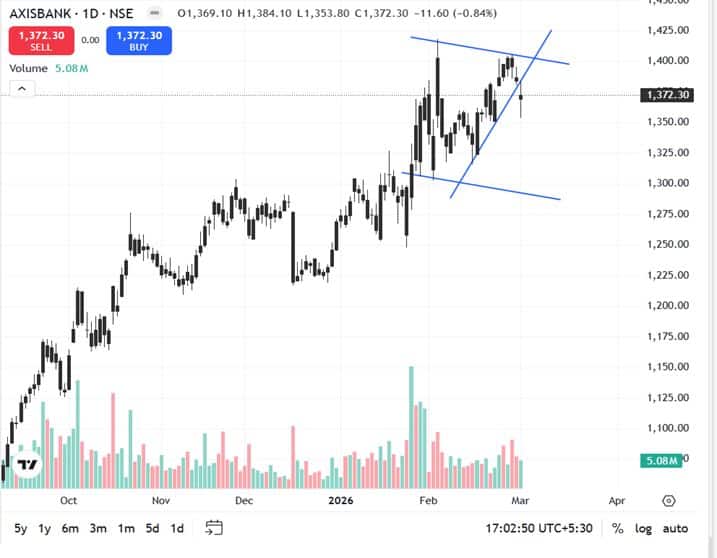
Axis Bank has provided a sell crossover in its short-term momentum indicator, and along with that, there is a clear sign of long unwinding in its futures data. The options data also indicates a huge Call base from the Rs 1,450–1,400 strikes, which will lead to a pause in the upside, i.e., it will act as a hurdle in the near term. Hence, the risk-reward is favourable on the short side. Sell Axis Bank Futures in the range of Rs 1,370–1,380.
Strategy: Sell
Target: Rs 1,340, Rs 1,320
Stop-Loss: Rs 1,400
Jigar S Patel, Senior Manager - Equity Research at Anand Rathi
Bharat Electronics | CMP: Rs 454
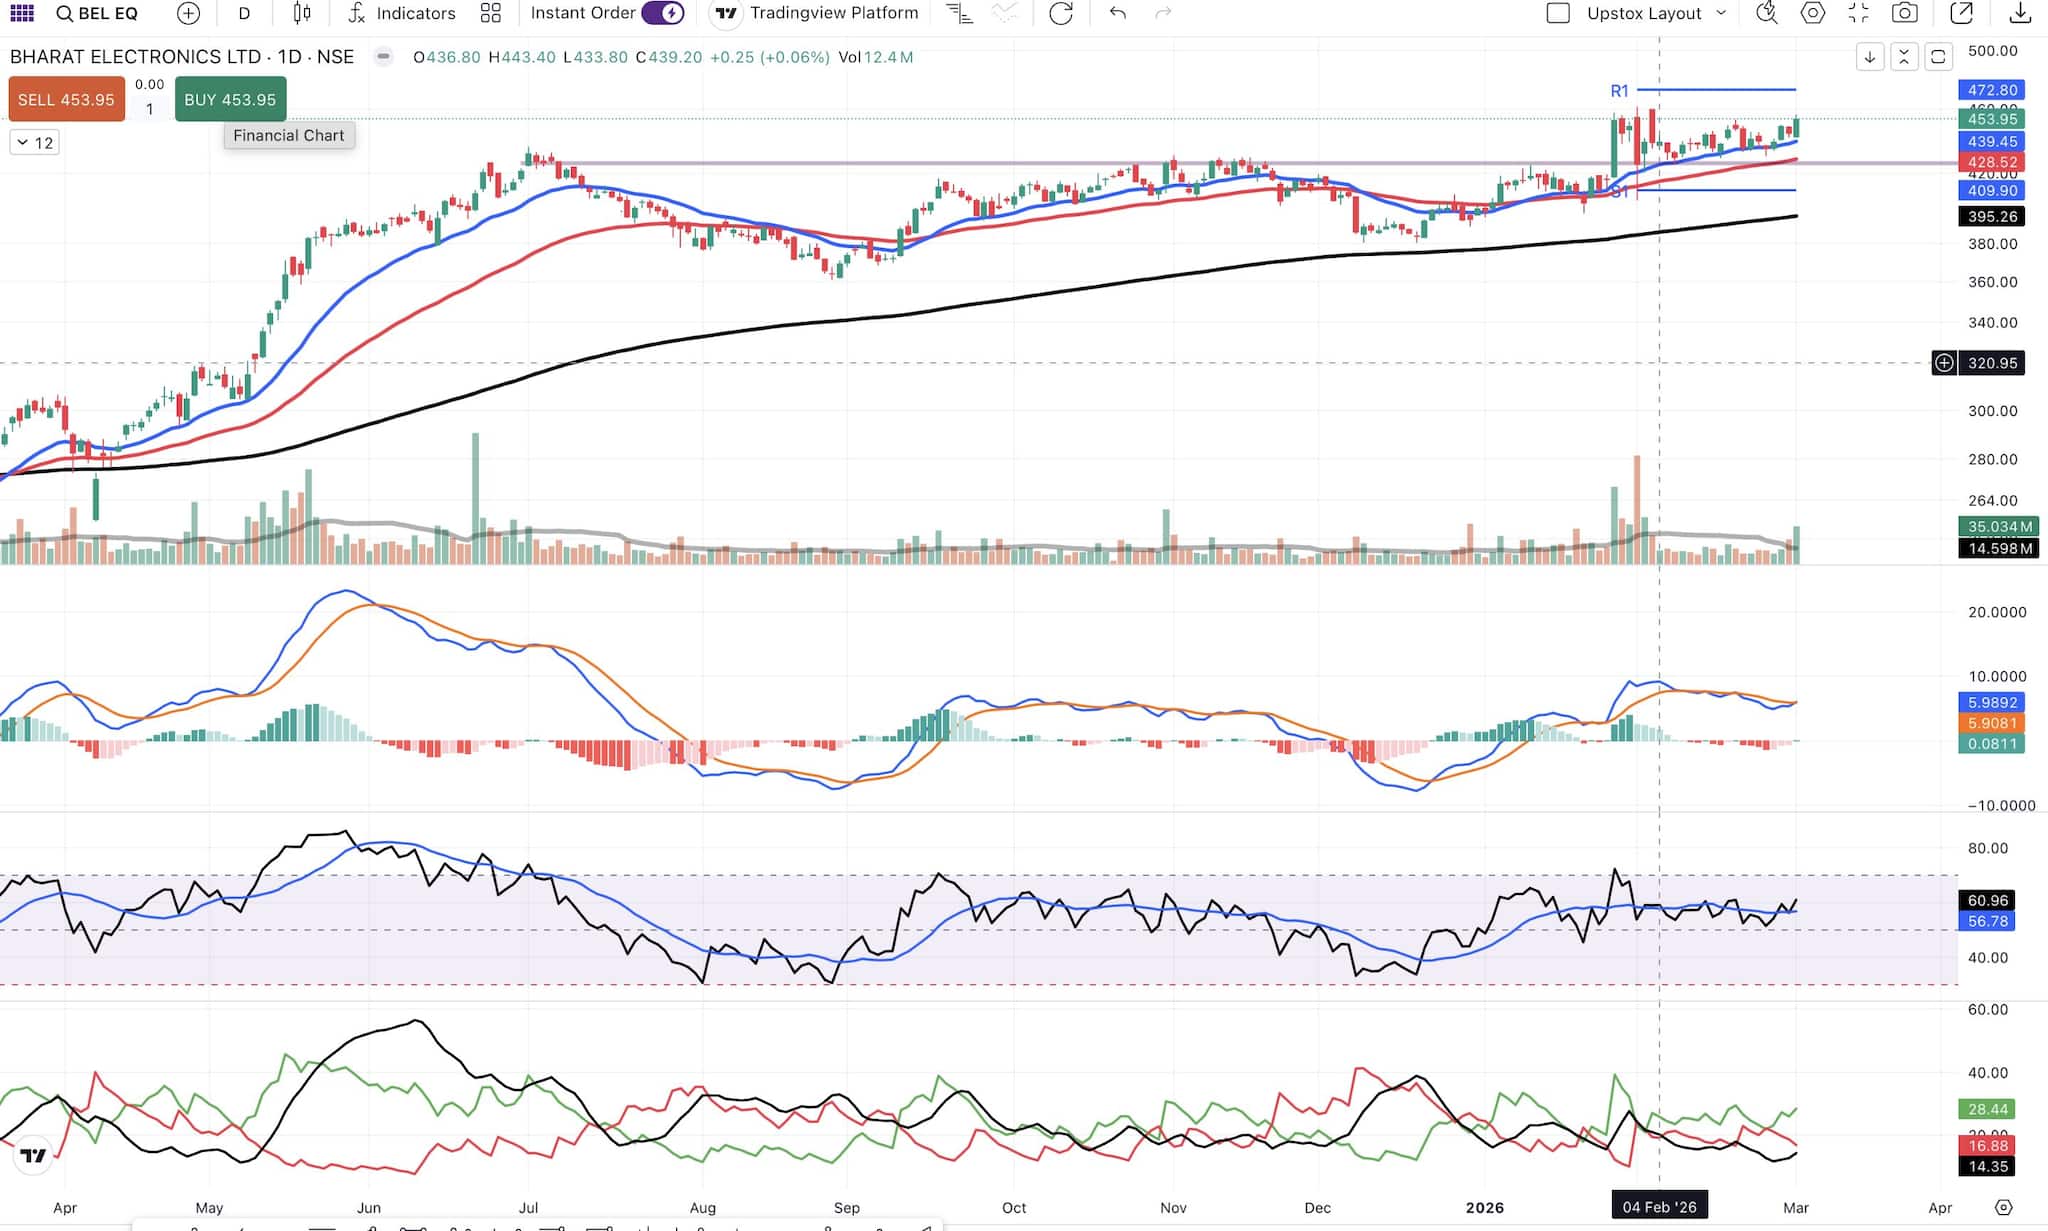
Bharat Electronics (BEL) is witnessing sustained support near its 20-day DEMA, with price action consolidating around this level—a sign of underlying strength. Momentum indicators also remain supportive; the RSI is holding firmly around the 50 mark, reflecting balanced momentum with a slight bullish bias.
Meanwhile, the DMI setup remains positive, suggesting that buyers continue to maintain control in the broader trend. As long as BEL sustains above the 20-day DEMA, the structure remains constructive. Traders may consider entering long positions in the Rs 455–445 zone.
Strategy: Buy
Target: Rs 485
Stop-Loss: Rs 435
Oil India | CMP: Rs 488
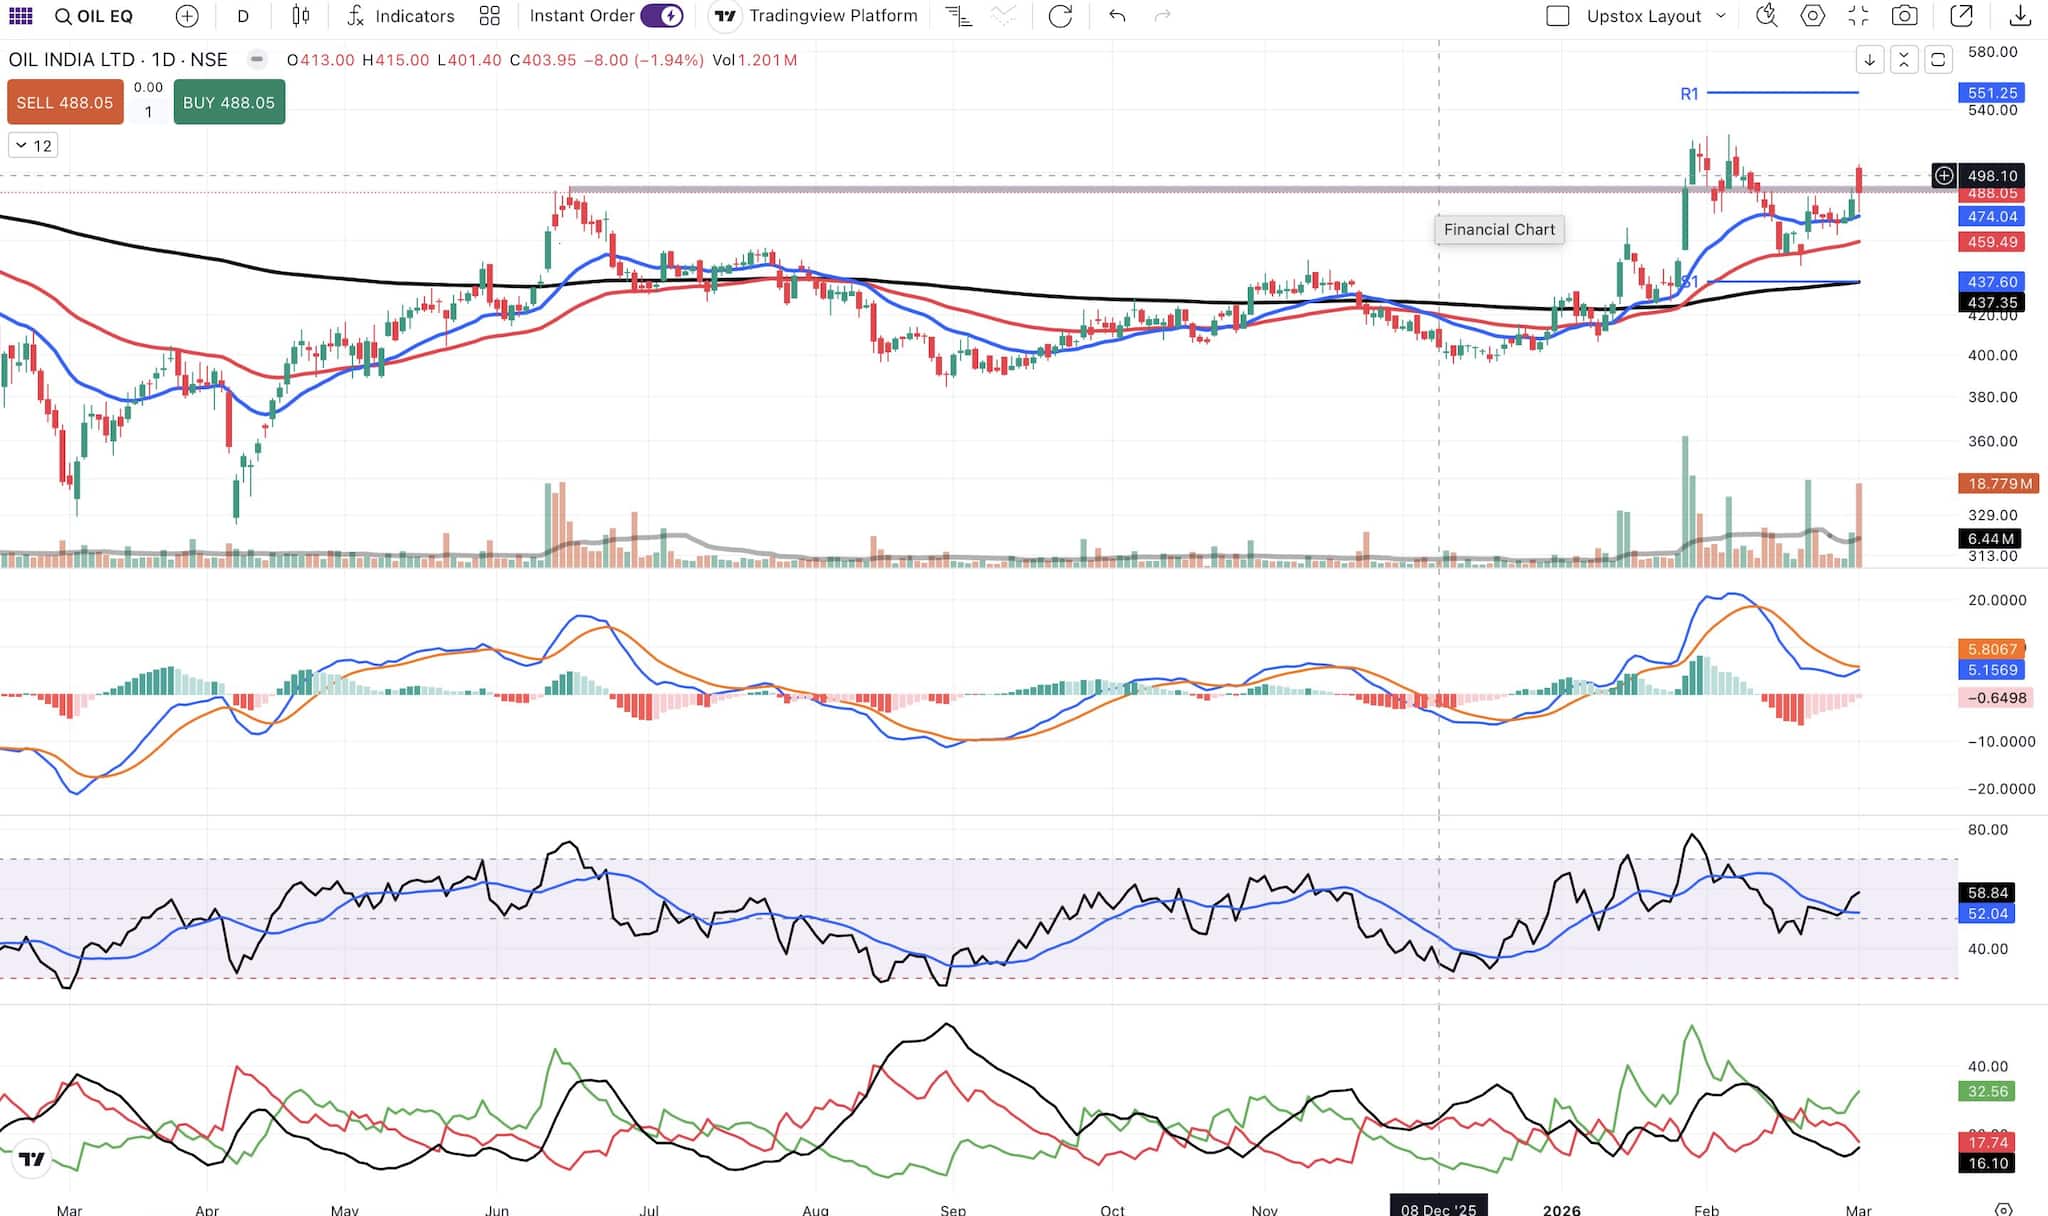
OIL is witnessing sustained support near its 20-day DEMA, with price action consolidating around this level—a sign of underlying strength. Momentum indicators also remain supportive; the RSI is holding firmly around the 50 mark, reflecting balanced momentum with a slight bullish bias.
Meanwhile, the DMI setup remains positive, suggesting that buyers continue to maintain control in the broader trend. As long as OIL sustains above the 20-day DEMA, the structure remains constructive. Traders may consider entering long positions in the Rs 490–480 zone.
Strategy: Buy
Target: Rs 530
Stop-Loss: Rs 460
Multi Commodity Exchange of India | CMP: Rs 2,501.2
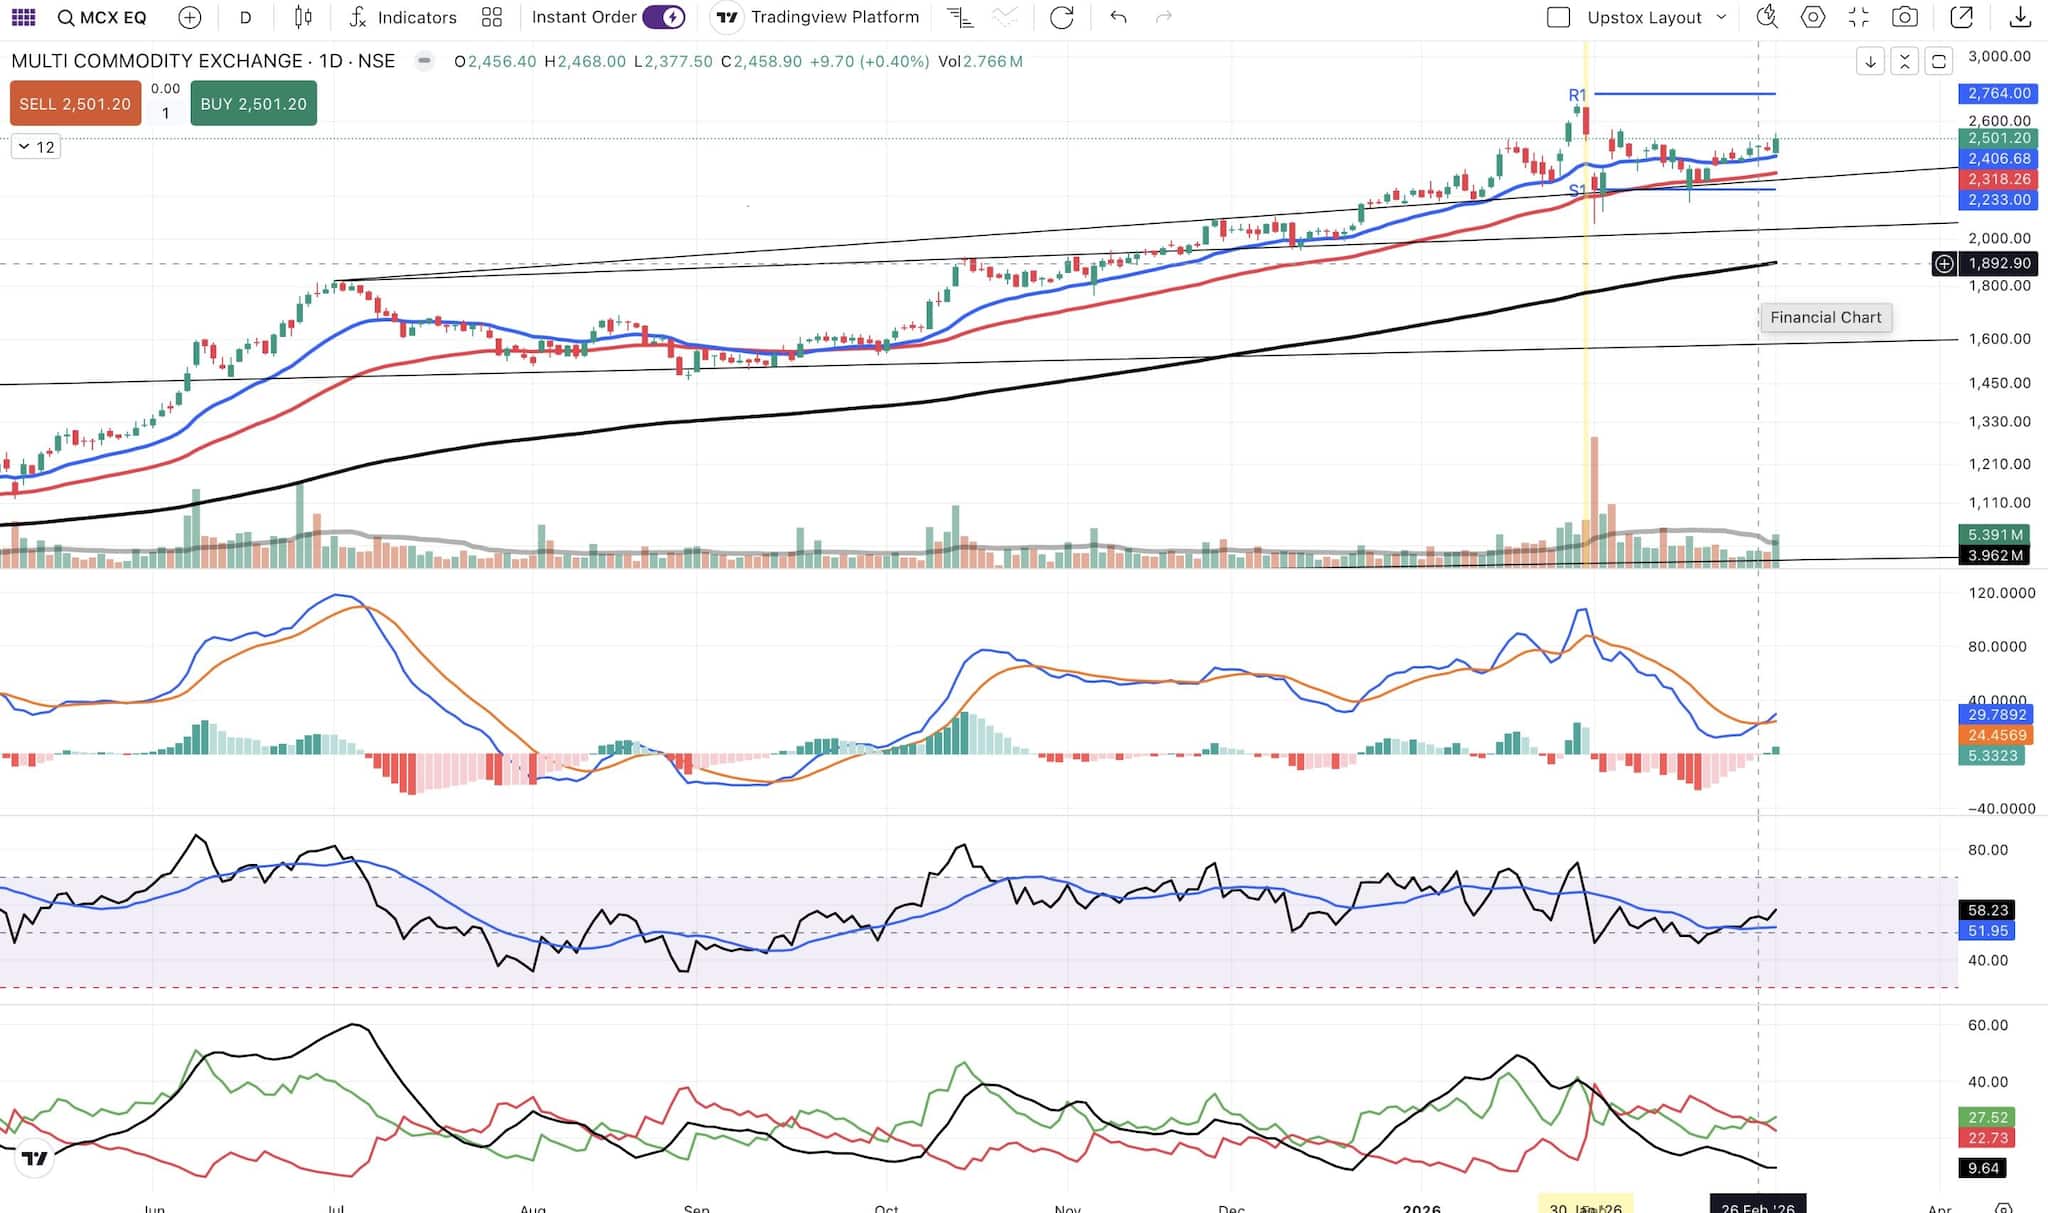
MCX is currently taking support near its 20-day DEMA, maintaining a constructive technical structure. Prior to the recent breakout, the stock witnessed a phase of consolidation around the same moving average, indicating strong institutional accumulation at these levels. The ability to sustain above the 20-day DEMA reflects underlying strength and trend continuation potential.
Momentum indicators further support the bullish setup—the RSI is holding firmly above the 50 mark, signaling positive momentum, while the MACD has delivered a fresh bullish crossover, indicating a shift toward upward momentum. As long as MCX sustains above the 20-day DEMA, the bias remains positive, and the current structure suggests potential for further upside in the near term. Traders may consider entering long positions in the Rs 2,450–2,400 zone.
Strategy: Buy
Target: Rs 2,700
Stop-Loss: Rs 2,300
Aditya Thukral, Founder & Analyst of AT Research & Risk Managers
Aditya Infotech | CMP: Rs 1,742.5
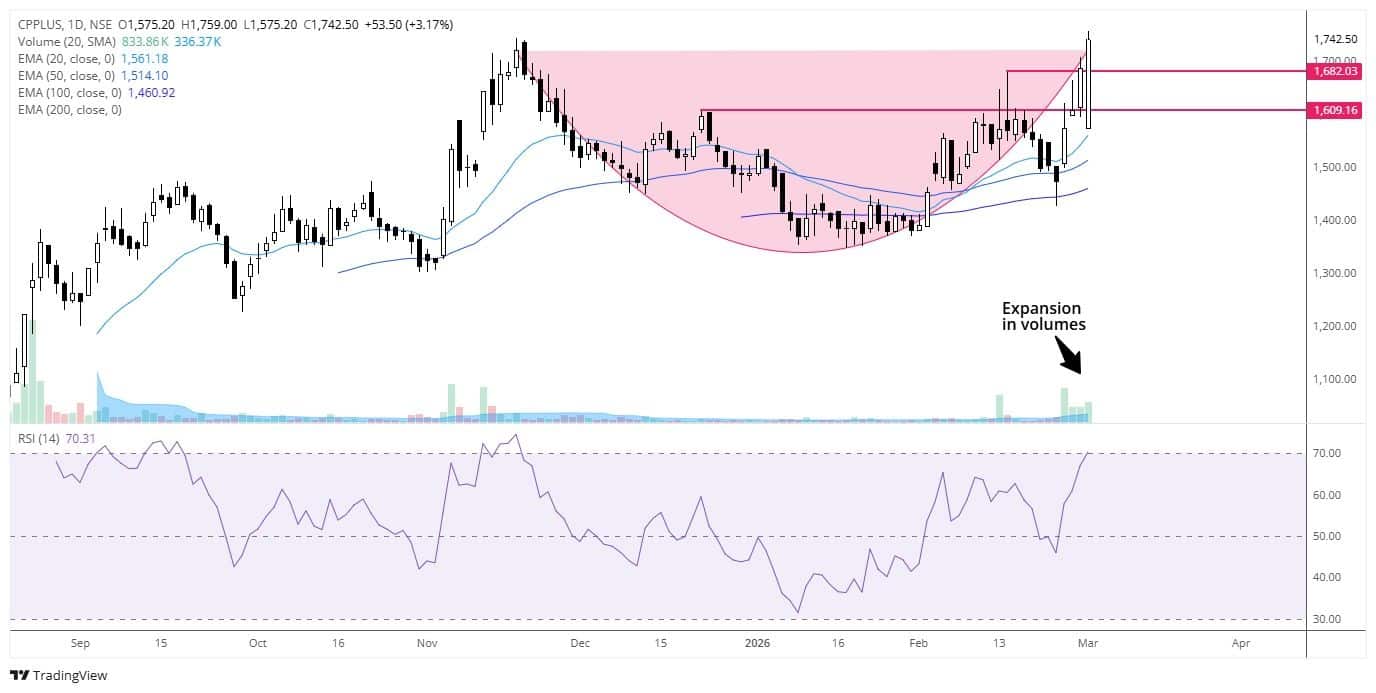
Aditya Infotech has exhibited a rounded cup-shaped pattern, and a breakout was witnessed as the stock price recorded an all-time high close. This breakout was accompanied by an expansion in volumes over the past few trading sessions. The stock has been in an uptrend across all time frames, with the formation of higher highs and higher lows.
The previous resistance of Rs 1,608 is now acting as support, following the principle of polarity. The stock is consistently trading above all its major exponential moving averages, i.e., the 20-day, 50-day, 100-day, and 200-day EMAs, with all the EMAs sloping higher. Fresh buying can be initiated in the stock on dips around the minor support of Rs 1,682.
Strategy: Buy
Target: Rs 1,840
Stop-Loss: Rs 1,604
Data Patterns India | CMP: Rs 3,204.3
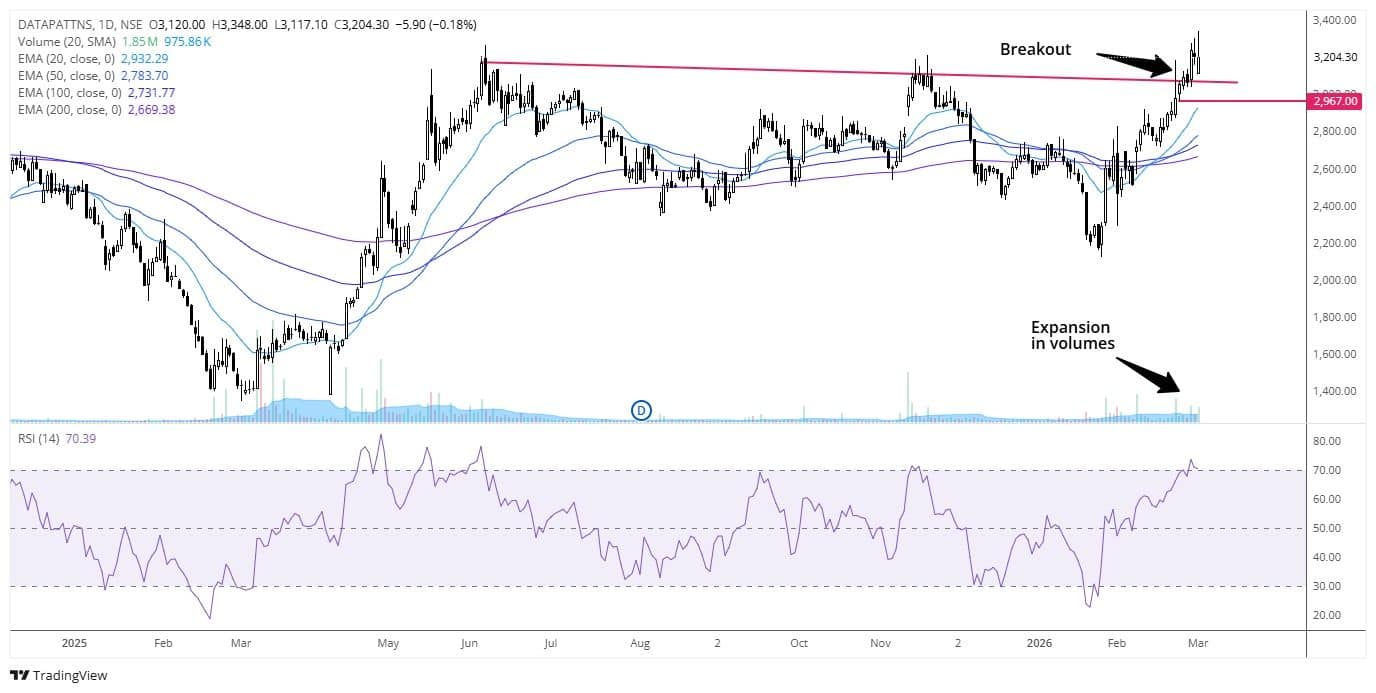
A fresh 52-week high has been witnessed in Data Patterns over the past three trading sessions. The stock cleared the important resistance zone, which is now working as support, as it has been closing and sustaining above the resistance line for quite some days.
The structure of higher highs and higher lows, along with prices closing above all the major EMAs, i.e., the 20-day, 50-day, 100-day, and 200-day EMAs, which are sloping upwards, confirms an established uptrend. We are witnessing a breakout from medium-term resistances in the direction of the larger uptrend, the implications of which are bullish. The stock can be bought on dips in the range of Rs 3,070–3,080, as the previous resistance zone has now turned into a support zone.
Strategy: Buy
Target: Rs 3,308
Stop-Loss: Rs 2,966
HDFC Bank | CMP: Rs 879.4
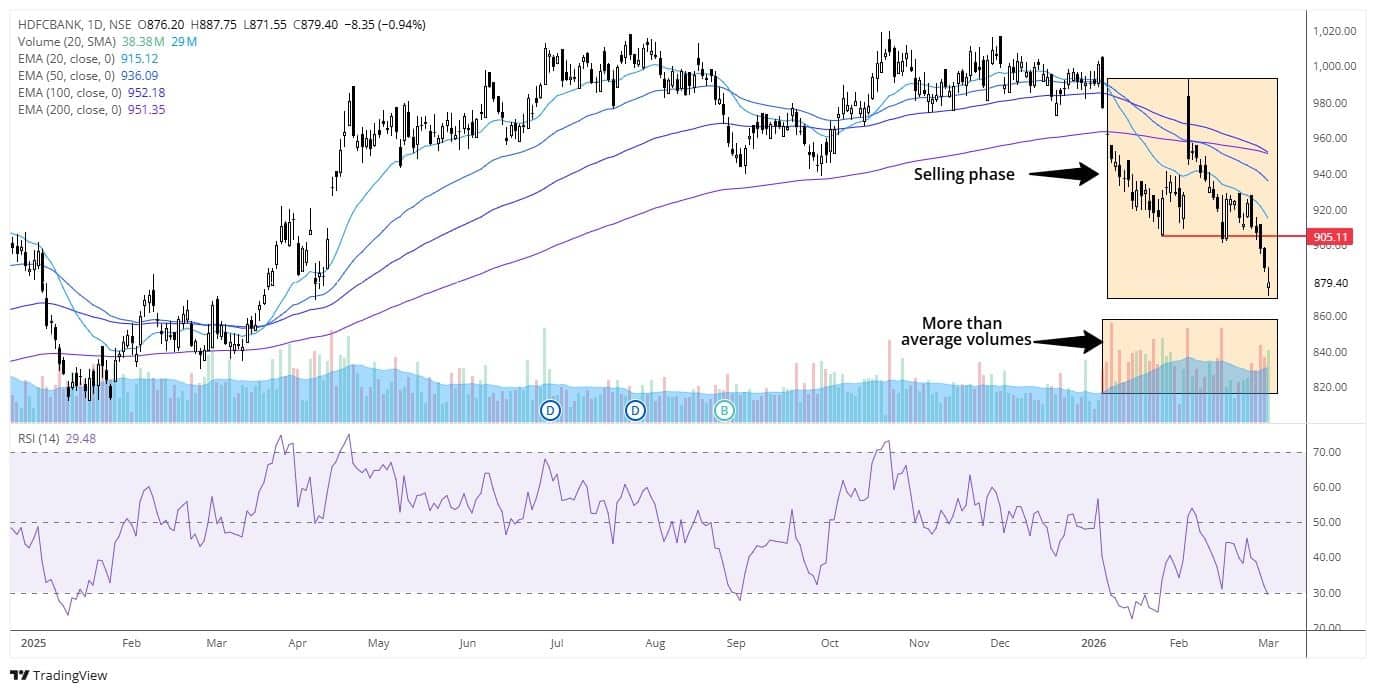
HDFC Bank has been sliding lower, forming a lower highs and lower lows structure, and has been exhibiting highly bearish price action, with the stock closing below the previous day's low for five consecutive trading sessions. The stock is consistently trading below all its major exponential moving averages, viz., the 20-day, 50-day, 100-day, and 200-day EMAs, with all the EMAs sloping downwards, which establishes a strong downtrend.
A continuation of this downtrend is expected, as the 14-period RSI is still above oversold zones and provides an opportunity to short-sell the stock. Fresh shorts can be executed in the stock futures at current prices or below Rs 877, expecting a continuation of the downtrend, as previous supports have now turned into resistances.
Strategy: Sell
Target: Rs 840
Stop-Loss: Rs 895
Vidnyan S Sawant, Head of Research at GEPL Capital
APL Apollo Tubes | CMP: Rs 2,222.3
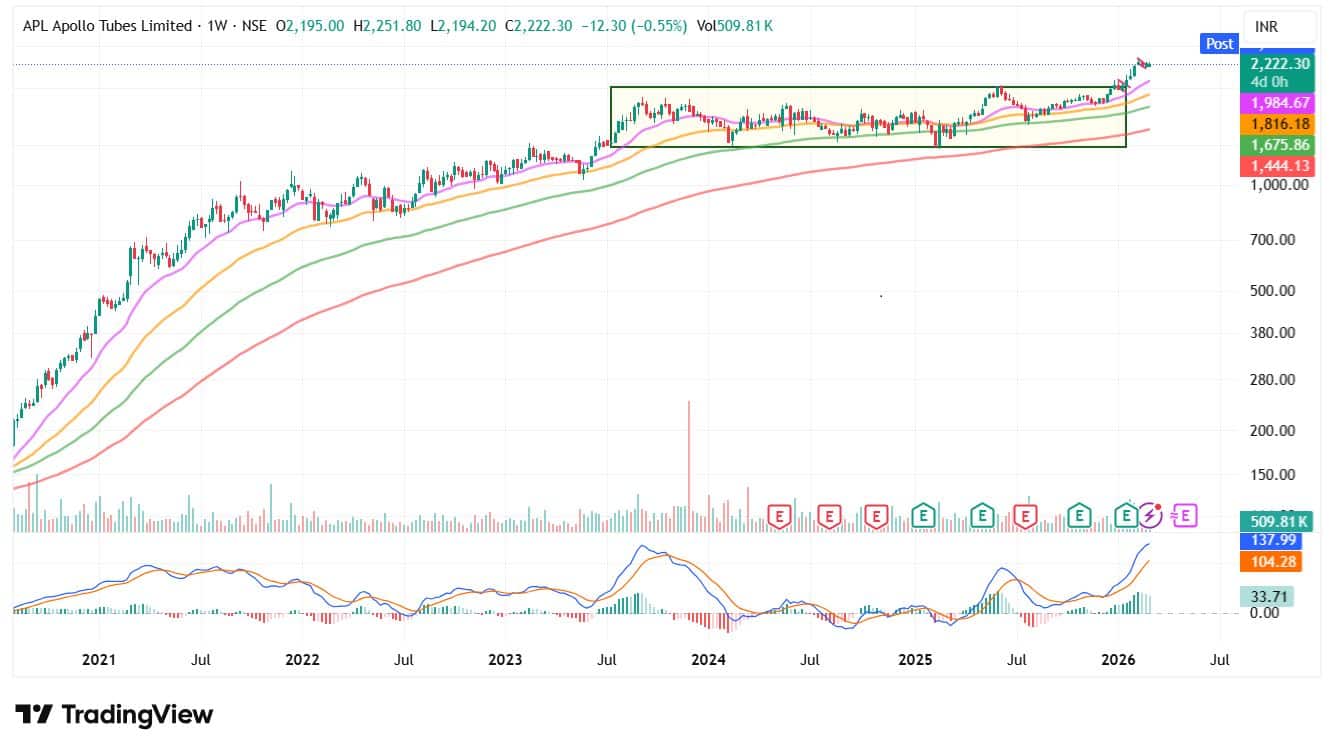
APL Apollo Tubes has shown strong structural strength, with a decisive breakout in January 2026 from an eight-quarter consolidation, signaling the start of a fresh expansion phase. The stock continues to trade above its 20- and 50-week EMAs, confirming a firm primary uptrend.
On the daily chart, higher highs and higher lows, along with a falling wedge breakout supported by a bullish mean reversion from the 20-day DEMA and a rising MACD, indicate sustained momentum and a positive near- to medium-term outlook.
Strategy: Buy
Target: Rs 2,400
Stop-Loss: Rs 2,130
Oil and Natural Gas Corporation | CMP: Rs 282.2
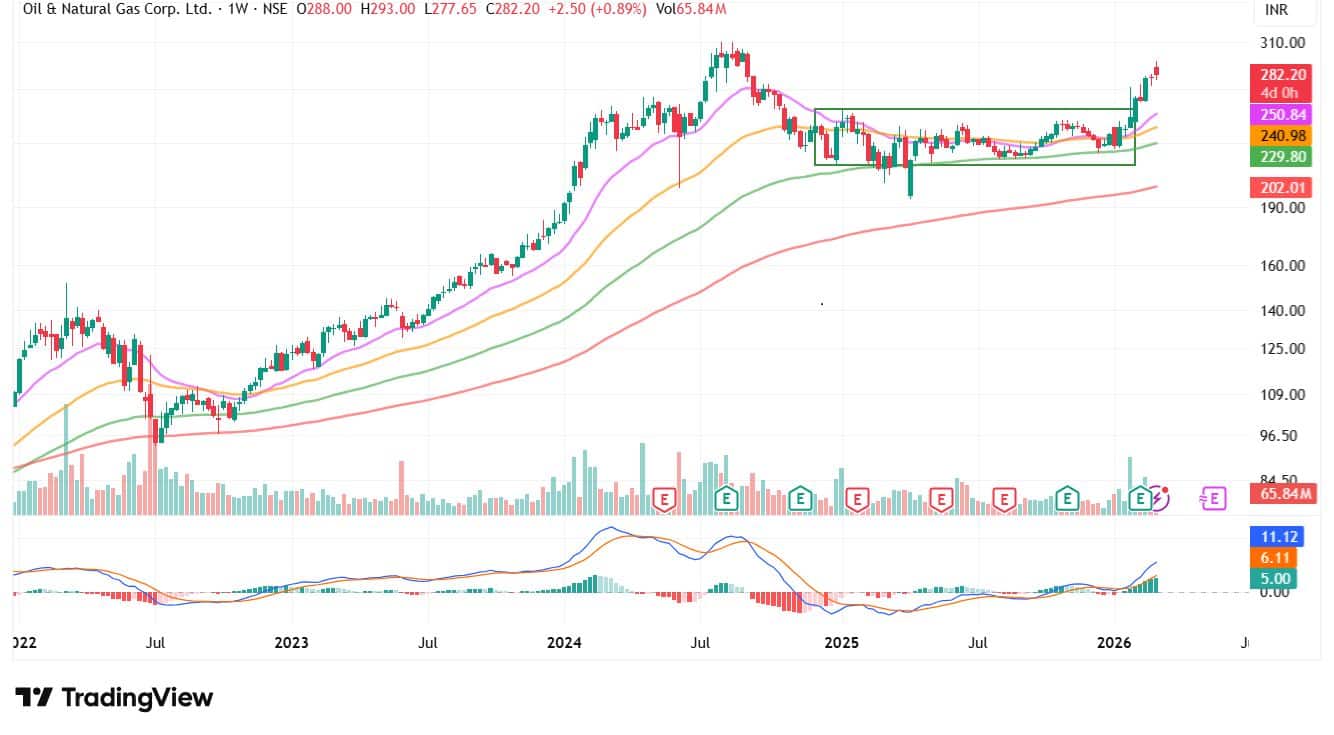
ONGC has broken out of a one-year base near its 100-week EMA in February 2026, signaling a clear improvement in sentiment and a strengthening weekly price structure. The move is supported by volumes rising above the 20-week average, indicating strong participation and potential institutional accumulation.
On the daily chart, the stock trades firmly above its 12-day, 20-day, and 50-day DEMAs, reflecting aligned short- to medium-term trends, while the MACD remains in buy mode, confirming sustained bullish momentum and a positive near-term bias.
Strategy: Buy
Target: Rs 302
Stop-Loss:Rs 270
Disclaimer: The views and investment tips expressed by experts on Moneycontrol are their own and not those of the website or its management. Moneycontrol advises users to check with certified experts before taking any investment decisions.Discover the latest Business News, Sensex, and Nifty updates. Obtain Personal Finance insights, tax queries, and expert opinions on Moneycontrol or download the Moneycontrol App to stay updated!
Find the best of Al News in one place, specially curated for you every weekend.
Stay on top of the latest tech trends and biggest startup news.


