


Bears gained more strength for another session, pushing the Nifty 50 down by 368 points on September 30. The breadth was negative, with 1,536 shares declining against 988 shares advancing on the NSE. Given the weak sentiment, the index is expected to sustain its downtrend in the upcoming sessions. Below are some trading ideas for the near term:
Jay Thakkar, Vice President & Head of Derivatives and Quant Research at ICICI SecuritiesIndraprastha Gas | CMP: Rs 558.55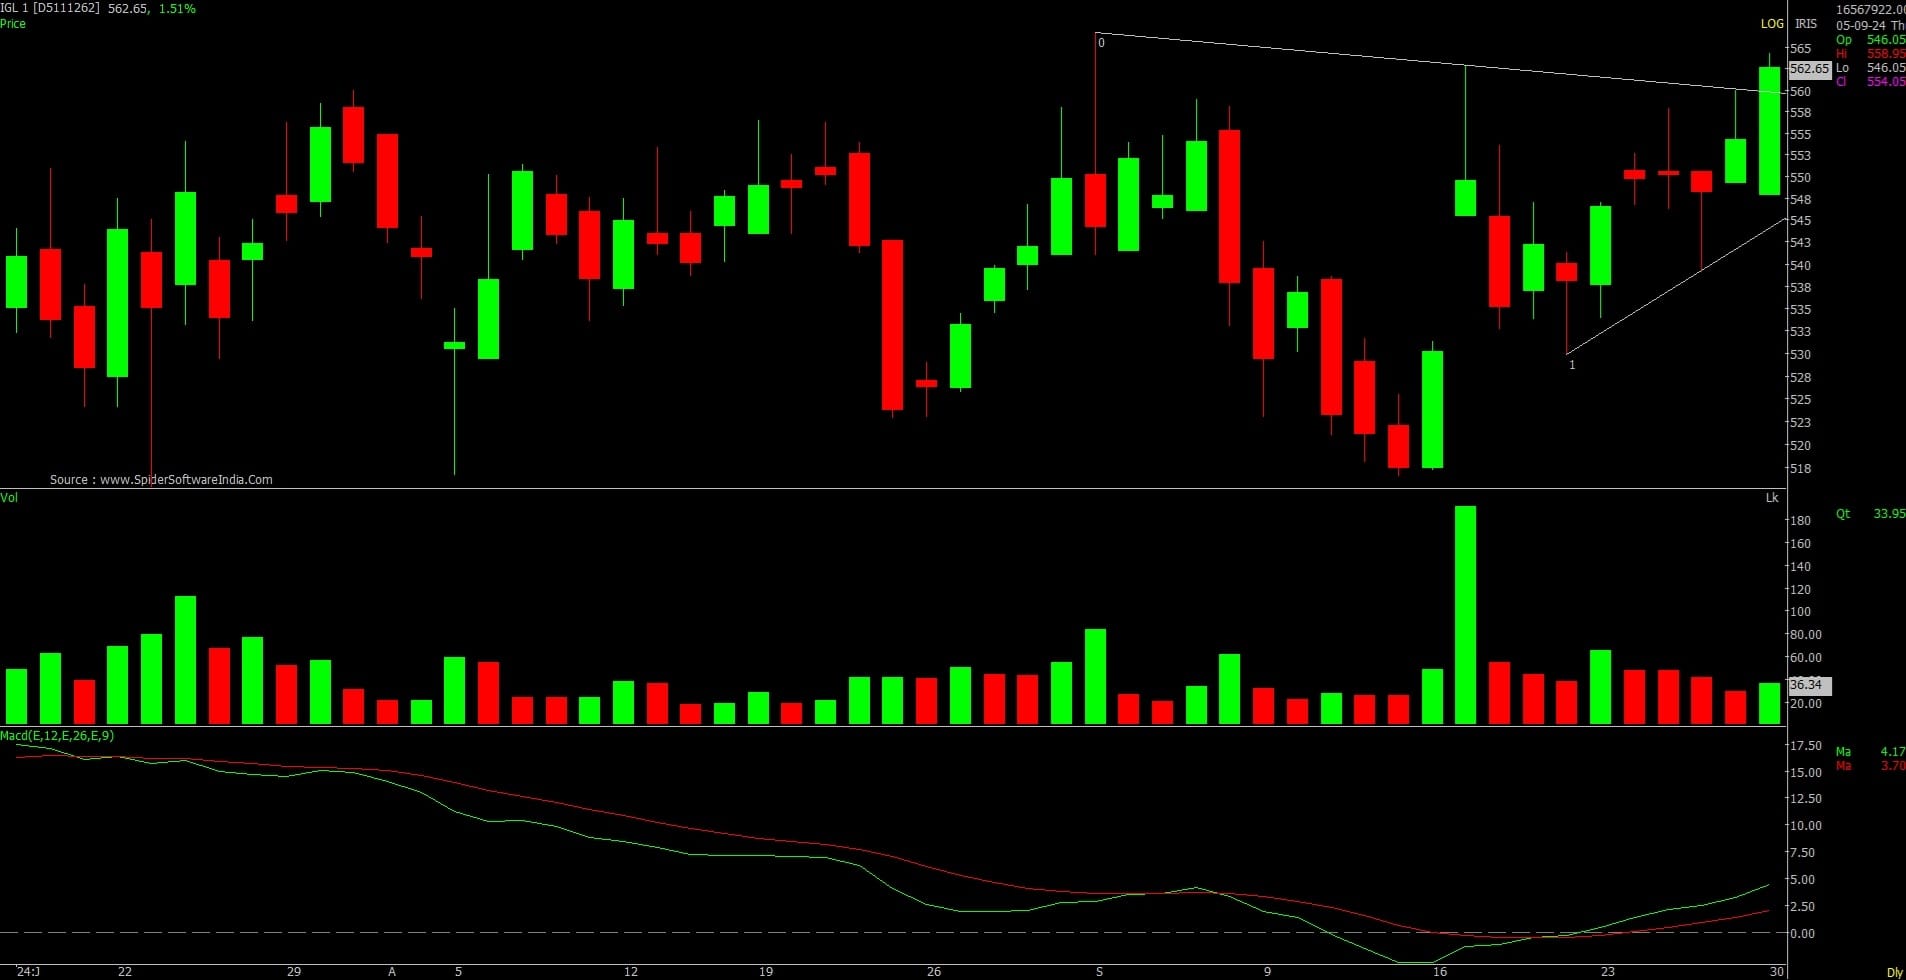
Indraprastha Gas has provided a breakout from a symmetrical triangular pattern with a bullish crossover in its daily as well as weekly MACD (Moving Average Convergence Divergence). It has closed above its maximum pain and modified maximum pain levels of Rs 550 and Rs 555, respectively. A close above Rs 560 will further fuel upward momentum, as the Rs 560 strike has the highest Call base. The stock has bounced back due to short covering and now has provided a breakout with long additions, indicating that the uptrend is likely to continue.
Strategy: Buy Futures
Target: Rs 580, Rs 595
Stop-Loss: Rs 547
Jindal Steel & Power | CMP: Rs 1040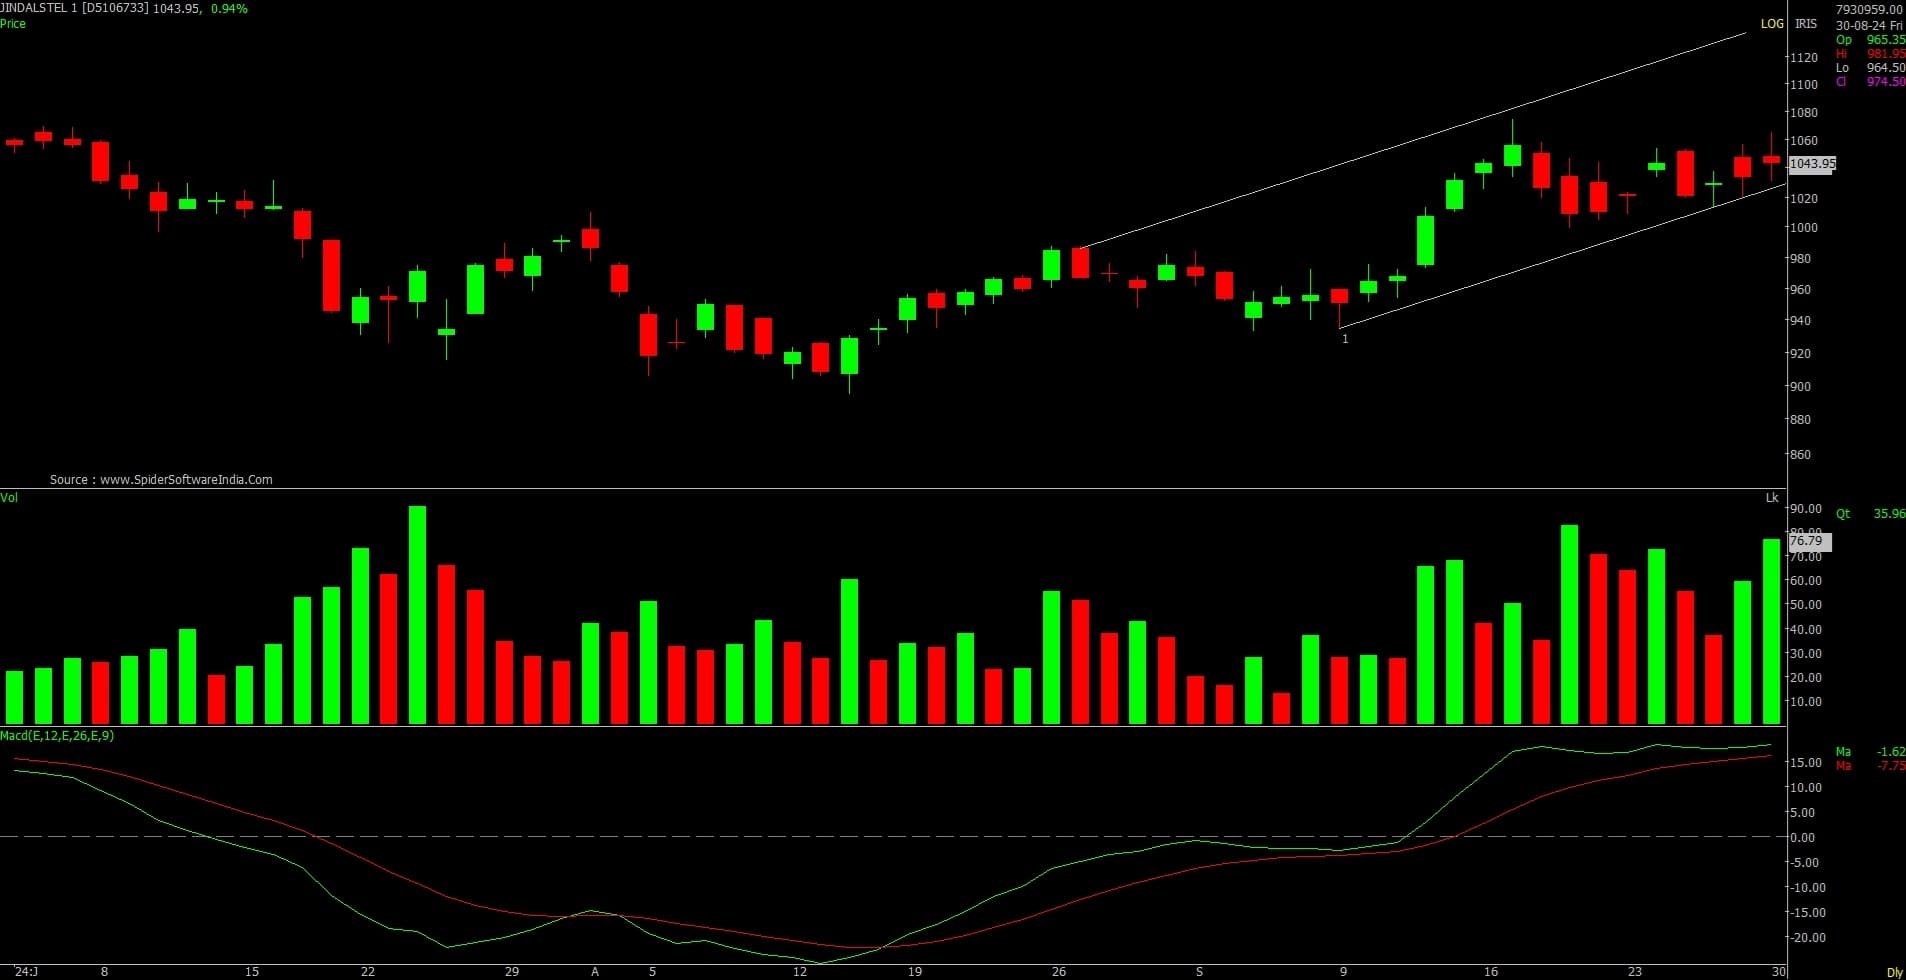
Jindal Steel has been consolidating and is in the process of forming a symmetrical triangular pattern in its wave 4. Following this, an upward breakout is likely in its wave 5, which will take prices to the upper end of the rising channel. The momentum indicator MACD has turned bullish on the daily charts, indicating that the short-term trend is sideways to positive. From a derivatives point of view, there is heavy Call writing in the range of Rs 1,040 and Rs 1,060 levels, above which short covering is likely. There is a strong buildup on the Put front from Rs 1,000 to Rs 960 strikes, indicating that the stock may find good support at lower levels. The stock is trading above its modified maximum pain levels of Rs 1,021 and around its maximum pain level of Rs 1,040. So, above the Rs 1,040 and Rs 1,060 strikes, the stock is likely to see further uptrend, eventually breaking out of this consolidation.
Strategy: Buy Futures
Target: Rs 1,080, Rs 1,100
Stop-Loss: Rs 1,019
Chambal Fertilisers and Chemicals | CMP: Rs 529.5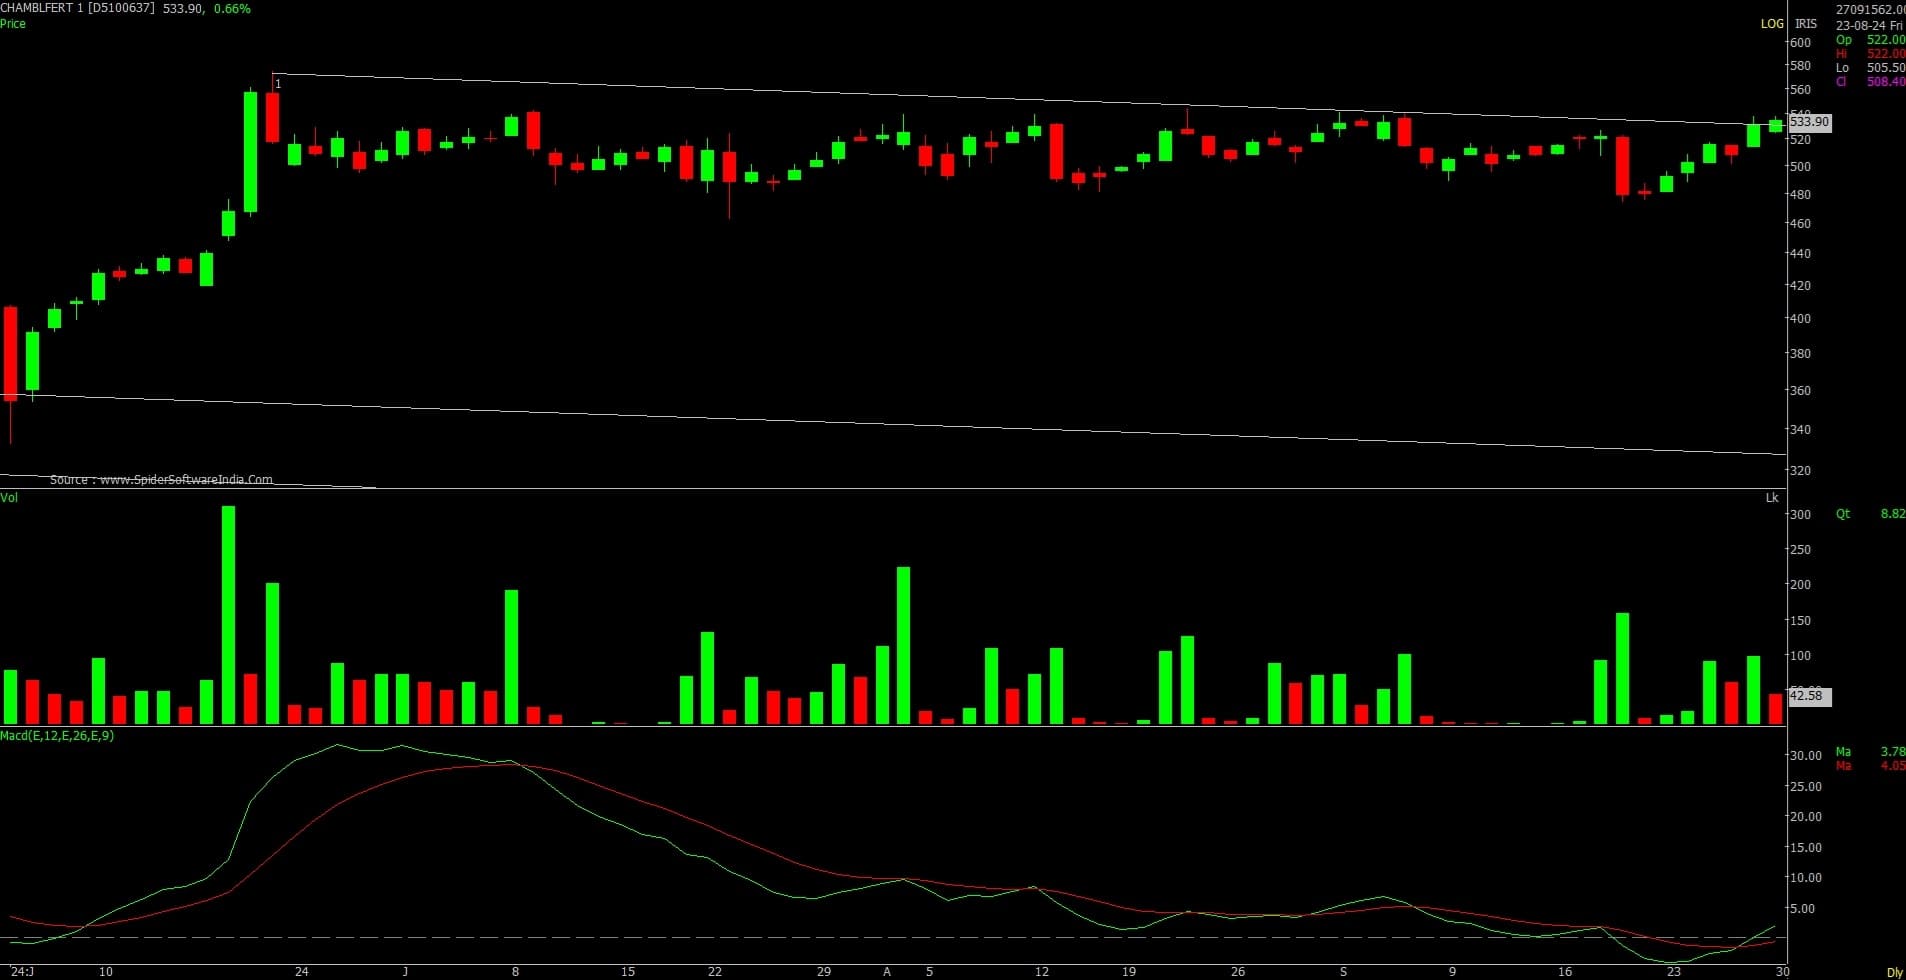
Chambal Fertilisers has provided a breakout from a falling trendline. The momentum indicator MACD has turned bullish from the zero-reference line on the daily charts. From a derivatives point of view, the stock has seen strong Put additions from Rs 450 to Rs 530 strikes, while Rs 530 to Rs 550 strikes also witnessed good additions on the Call front. Once the range of Rs 530 to Rs 550 is cleared, there will be a clear uptrend in the stock. Based on the technical breakout, Put additions, and bullish crossover in its momentum, the probability of an upward breakout from a derivatives point of view is also higher.
Strategy: Buy Futures
Target: Rs 557, Rs 570
Stop-Loss: Rs 516
Pravesh Gour, Senior Technical Analyst at Swastika InvestmartPCBL | CMP: Rs 577.6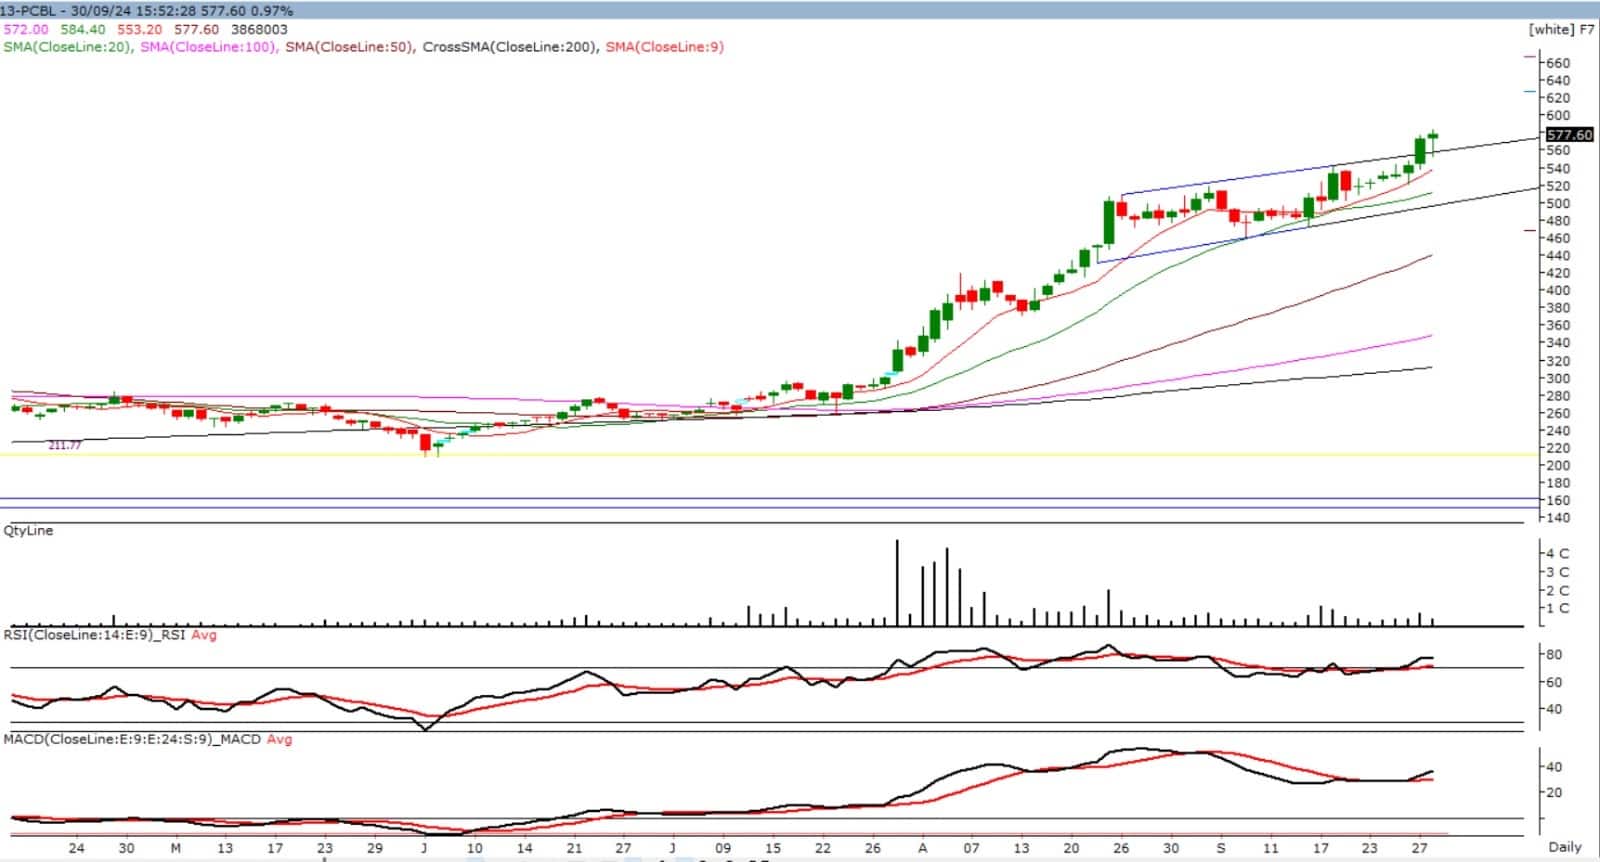
On a longer horizon, PCBL is exhibiting traditional bullish momentum, forming higher highs and higher lows. It has broken out of an upward channel formation pattern. The counter has a lucrative structure as it is trading above all significant moving averages. The momentum indicator RSI (Relative Strength Index) is positively poised, while MACD is witnessing a centerline crossover on the upside. On the higher side, Rs 600 is acting as an important psychological level; above this, we can expect the level of Rs 660+ in the near short term. On the lower side, Rs 520 will act as major support during any correction.
Strategy: Buy
Target: Rs 660
Stop-Loss: Rs 520
Century Textiles and Industries | CMP: Rs 2,850
Century Textiles has broken a triangle formation on the daily chart and shows a strong bullish setup, having retested its previous breakout level of Rs 2,700 after reaching a fresh all-time high. The overall structure appears lucrative, as the stock is trading above all of its moving averages. On the upside, Rs 2,900-2,940 are key resistance levels, and a breakout above this zone could lead to a move towards Rs 3,000+ in the short to long term. On the downside, Rs 2,690 serves as important support during any potential correction.
Strategy: Buy
Target: Rs 3,084
Stop-Loss: Rs 2,690
Krishna Institute of Medical Sciences | CMP: Rs 556.55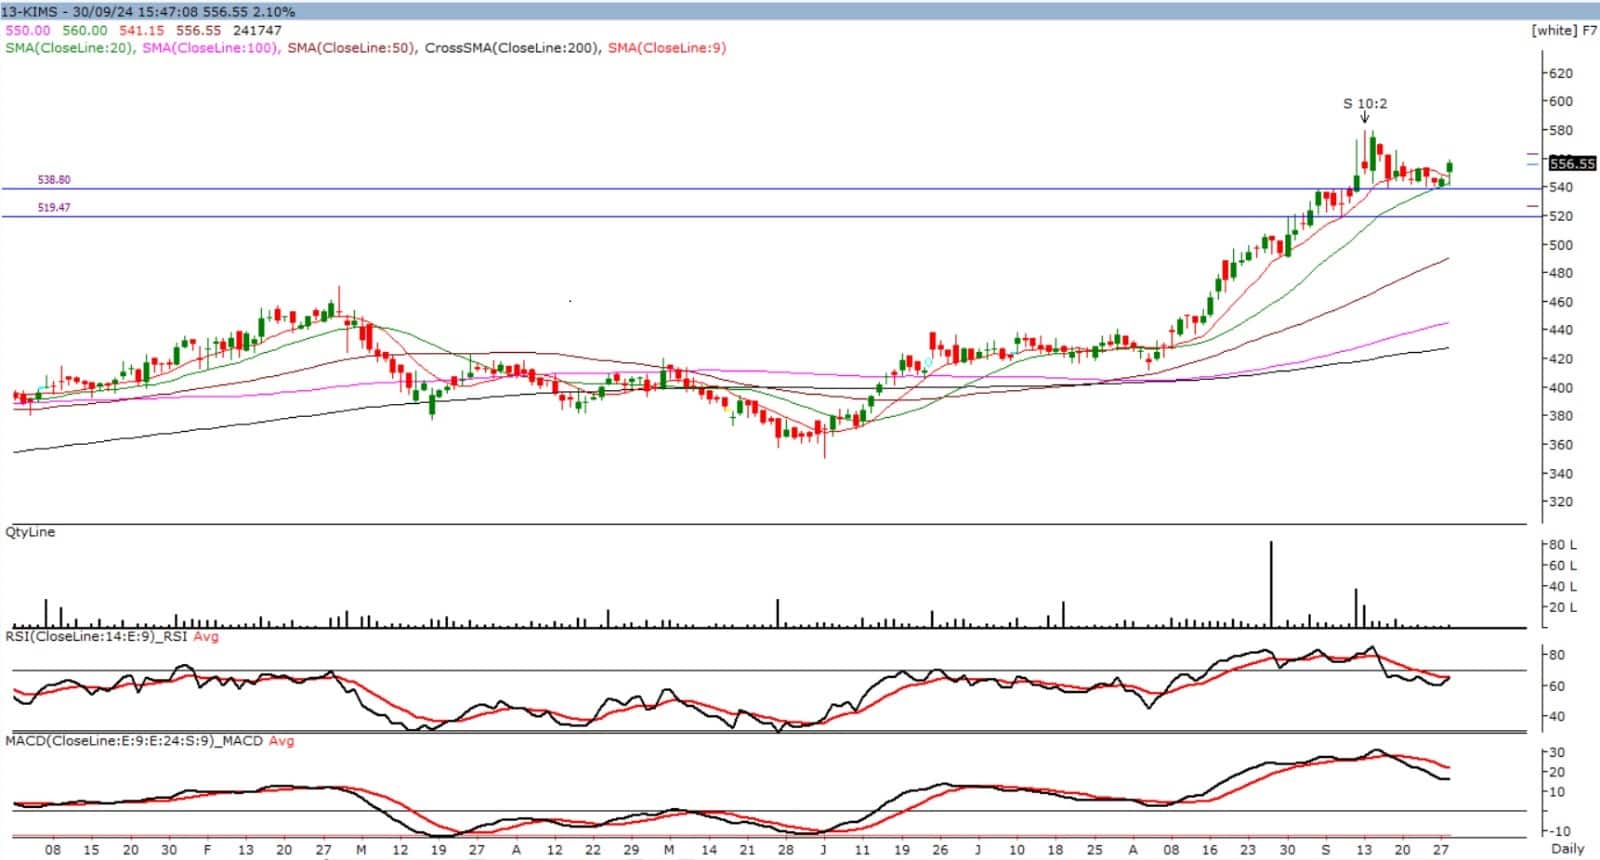
KIMS is again gaining momentum after building a strong base at the Rs 540 mark. On the weekly chart, we can observe a breakout from a Flag formation. Now, the 20-DMA (Days Moving Average) of Rs 540 is an important support level. On the upside, Rs 580 is an immediate horizontal resistance line; above this, bullish momentum may take it towards the Rs 600+ mark. The stock is trading above all of its important moving averages with a positive bias in momentum indicators.
Strategy: Buy
Target: Rs 600
Stop-Loss: Rs 530
Rohan Shah, Technical Analyst at Asit C Mehta Investment InterrmediatesAditya Birla Capital | CMP: Rs 237.5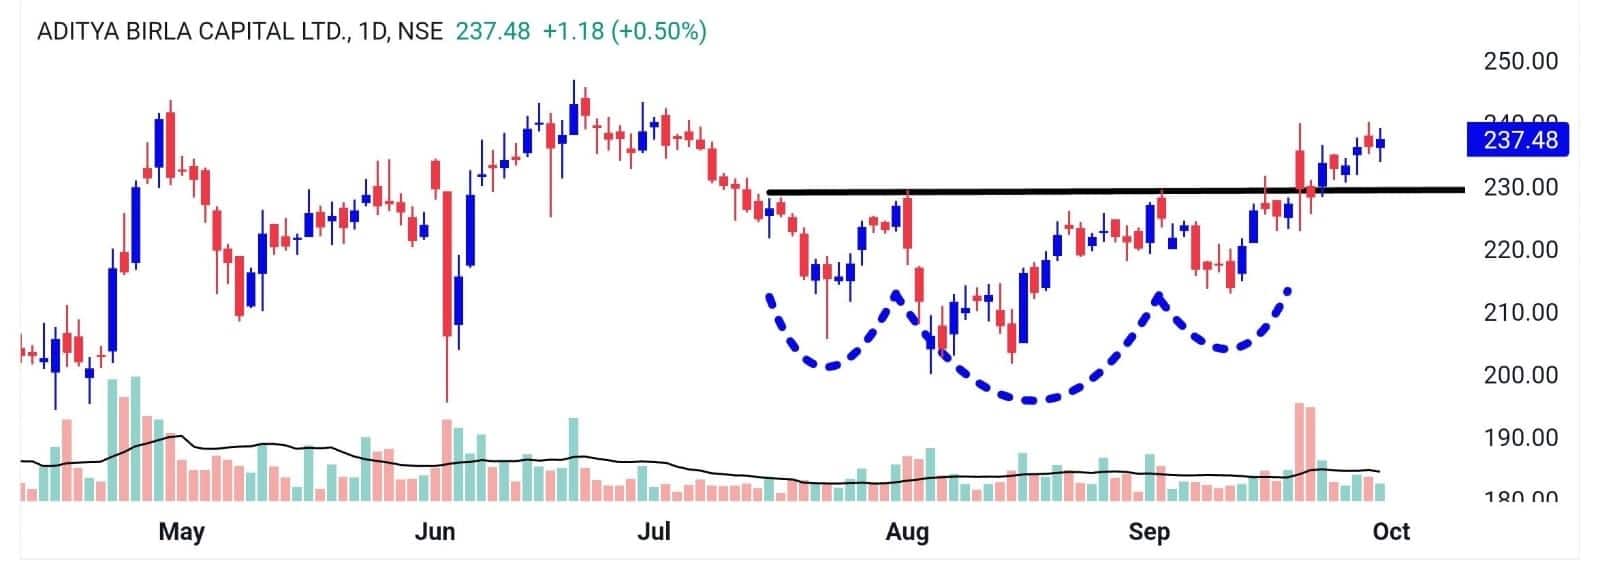
On the daily scale, Aditya Birla Capital registered a breakout from an Inverted Head & Shoulders price pattern with noticeable volumes. Despite recent weakness in the broader markets, the stock managed to hold strong, highlighting inherent strength in price. Based on the price pattern and volume activity, we expect the price to surpass its previous swing high.
Strategy: Buy
Target: Rs 258
Stop-Loss: Rs 227
SRF | CMP: Rs 2,498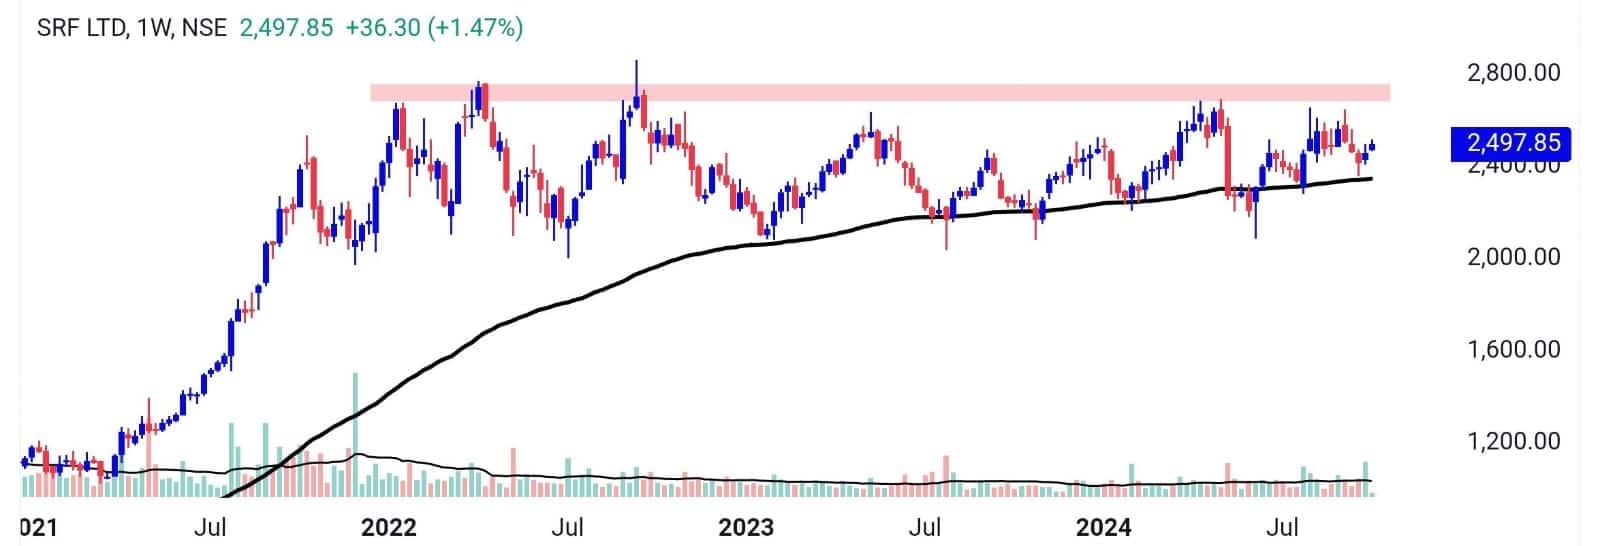
SRF has been trading sideways for many months, with Rs 2,700-2,800 acting as resistance, while the 100-week EMA is providing key support. Recently, the price has witnessed buying momentum from the 100-week EMA, with strong, noticeable volumes and high delivery readings. The momentum indicator RSI, trading above the 50 reading and giving a positive moving average crossover, complements the bullish bias on price.
Strategy: Buy
Target: Rs 2,750
Stop-Loss: Rs 2,360
Disclaimer: The views and investment tips expressed by investment experts on Moneycontrol.com are their own and not those of the website or its management. Moneycontrol.com advises users to check with certified experts before taking any investment decisions.Discover the latest Business News, Sensex, and Nifty updates. Obtain Personal Finance insights, tax queries, and expert opinions on Moneycontrol or download the Moneycontrol App to stay updated!
Find the best of Al News in one place, specially curated for you every weekend.
Stay on top of the latest tech trends and biggest startup news.


