


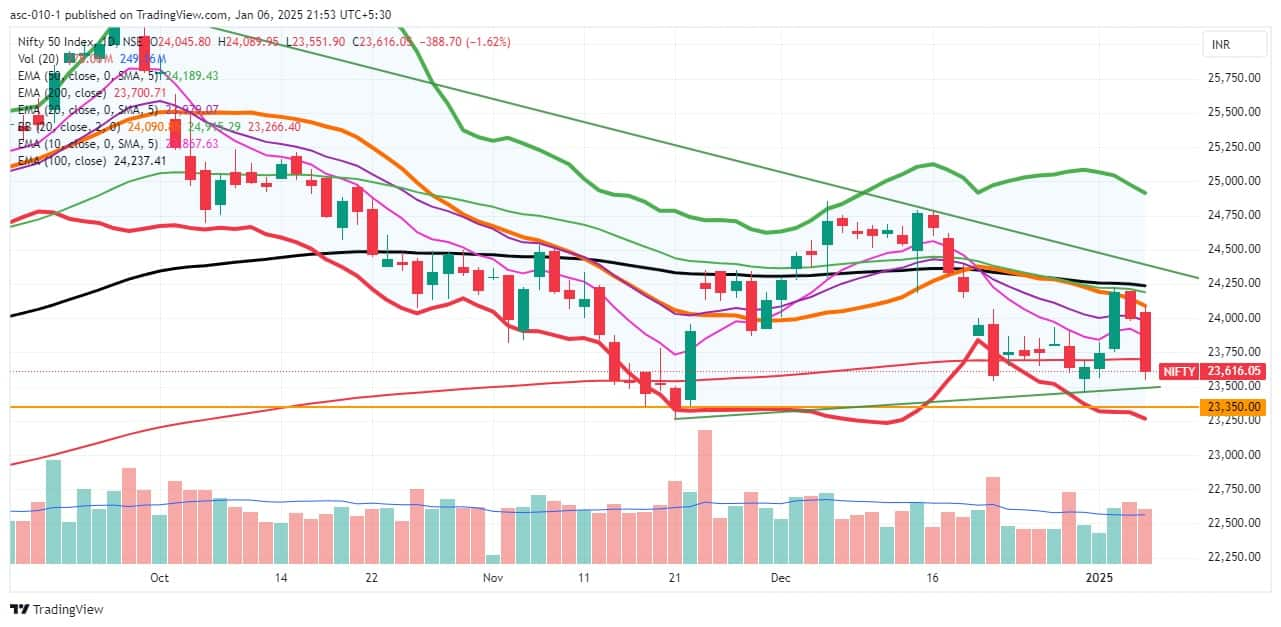
The market was caught in a complete bear trap on January 6, with the Nifty 50 falling 1.6% due to selling across sectors, breaking the crucial support of the 200-day EMA (23,700). The index extended its downtrend for the second consecutive session, with a negative bias in momentum indicators. If the index sustains below the 200-day EMA, the immediate downside target would be 23,450-23,500 (around the December low), followed by 23,263, which is a crucial support level. On the higher side, immediate resistance is placed at 23,700, followed by the 23,900-24,000 zone, experts said.
Here are 15 data points we have collated to help you spot profitable trades:
1) Key Levels For The Nifty 50 (23,616)
Resistance based on pivot points: 23,958, 24,085, and 24,291
Support based on pivot points: 23,547, 23,420, and 23,215
Special Formation: The Nifty 50 has formed a long bearish candlestick pattern on the daily timeframe with a lower top-lower bottom formation, indicating weakness. The index is currently trading in the lower band of the Bollinger Bands, as well as below all key moving averages, with a negative crossover in the momentum indicators RSI (Relative Strength Index) and MACD (Moving Average Convergence Divergence).
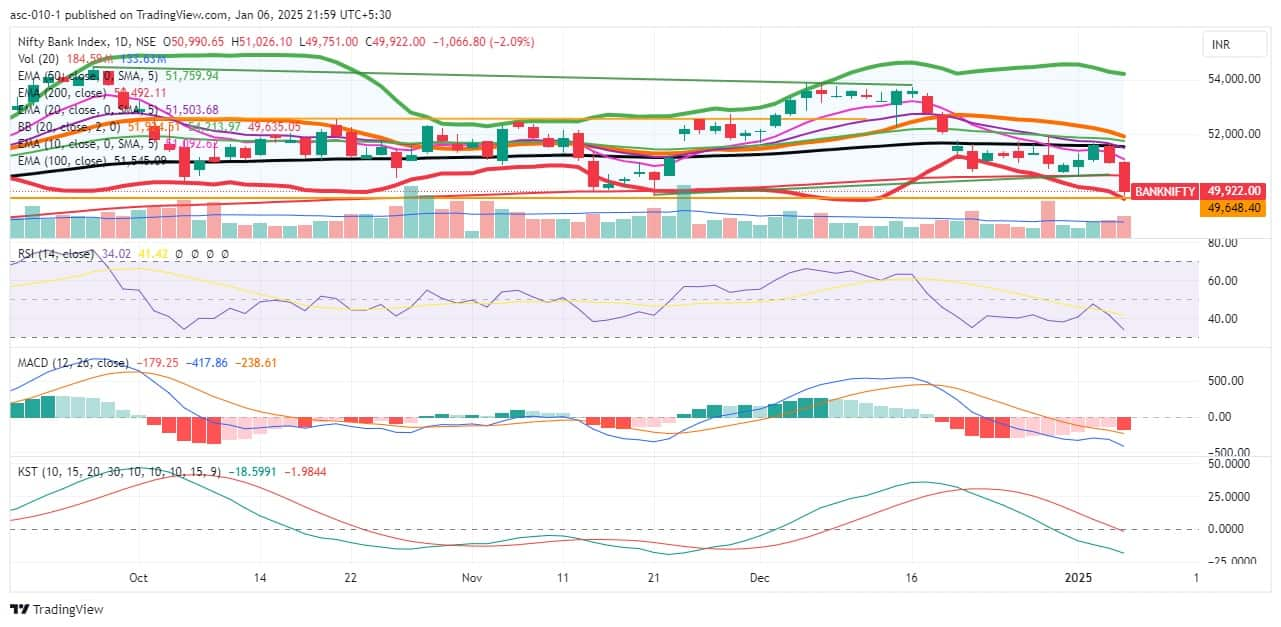
2) Key Levels For The Bank Nifty (49,922)
Resistance based on pivot points: 50,720, 51,021, and 51,508
Support based on pivot points: 49,746, 49,445, and 48,958
Resistance based on Fibonacci retracement: 50,871, 51,555
Support based on Fibonacci retracement: 49,281, 47,874
Special Formation: The Bank Nifty also formed a long red candle on the daily charts and moved closer to the lower end of the Bollinger Bands, with a lower high-lower low formation, signaling a downtrend. With a decisively falling below 200-day EMA, the banking index is now trading below all key moving averages and remains in the lower band of the Bollinger Bands. The momentum indicators RSI and MACD are also in negative territory.
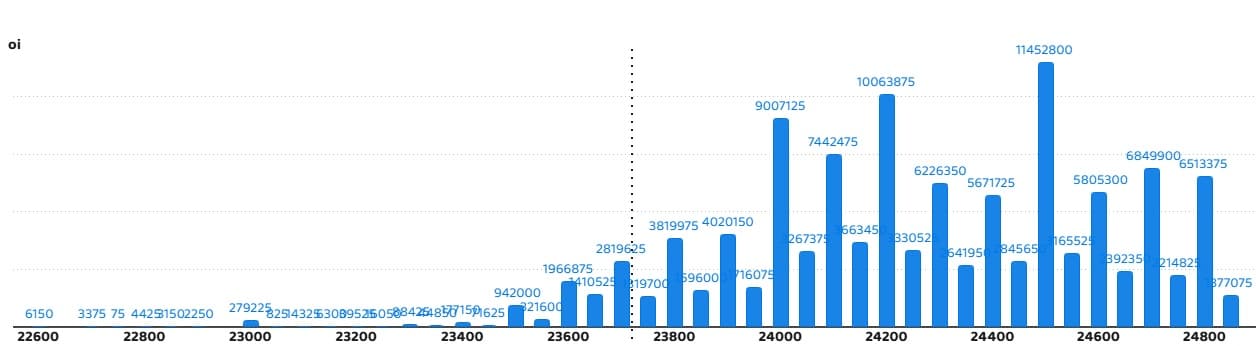
According to the weekly options data, the maximum Call open interest was seen at the 24,500 strike (with 1.14 crore contracts). This level can act as a key resistance for the Nifty in the short term. It was followed by the 24,200 strike (1 crore contracts) and the 24,000 strike (90 lakh contracts).
Maximum Call writing was observed at the 24,000 strike, which saw an addition of 38.15 lakh contracts, followed by the 24,500 and 24,200 strikes, which added 35.17 lakh and 27.47 lakh contracts, respectively. The maximum Call unwinding was seen at the 24,400 strike, which shed 9.33 lakh contracts, followed by the 24,800 and 24,850 strikes, which shed 5.64 lakh and 3.04 lakh contracts, respectively.
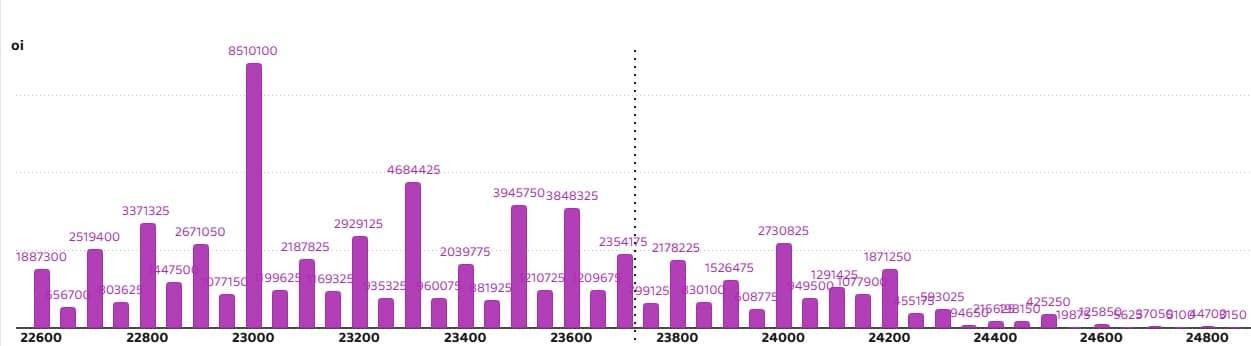
On the Put side, the 23,000 strike holds the maximum Put open interest (with 85.1 lakh contracts), which can act as a key support level for the Nifty. It was followed by the 23,300 strike (46.84 lakh contracts) and the 23,500 strike (39.45 lakh contracts).
The maximum Put writing was placed at the 23,300 strike, which saw an addition of 15.39 lakh contracts, followed by the 22,800 and 22,850 strikes, which added 12.09 lakh and 7.96 lakh contracts, respectively. The maximum Put unwinding was seen at the 23,700 strike, which shed 38.46 lakh contracts, followed by the 24,000 and 23,900 strikes, which shed 28.12 lakh and 19.69 lakh contracts, respectively.
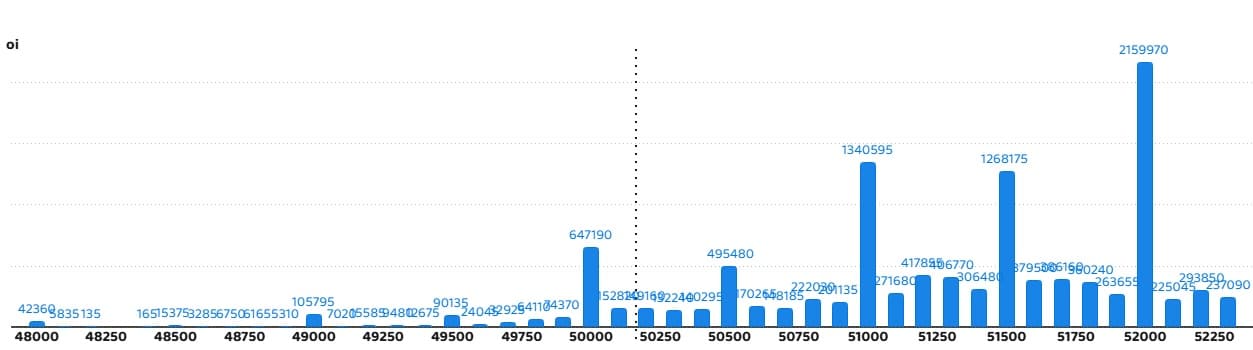
5) Bank Nifty Call Options Data
According to the monthly options data, the maximum Call open interest was seen at the 52,000 strike, with 21.59 lakh contracts. This can act as a key resistance level for the index in the short term. It was followed by the 51,000 strike (13.4 lakh contracts) and the 51,500 strike (12.68 lakh contracts).
Maximum Call writing was visible at the 51,000 strike (with the addition of 5.23 lakh contracts), followed by the 52,000 strike (4.57 lakh contracts) and the 50,500 strike (3.53 lakh contracts). The maximum Call unwinding was seen at the 51,700 strike, which shed 9,450 contracts, followed by the 48,700 and 48,600 strikes, which shed 3,480 and 3,735 contracts, respectively.
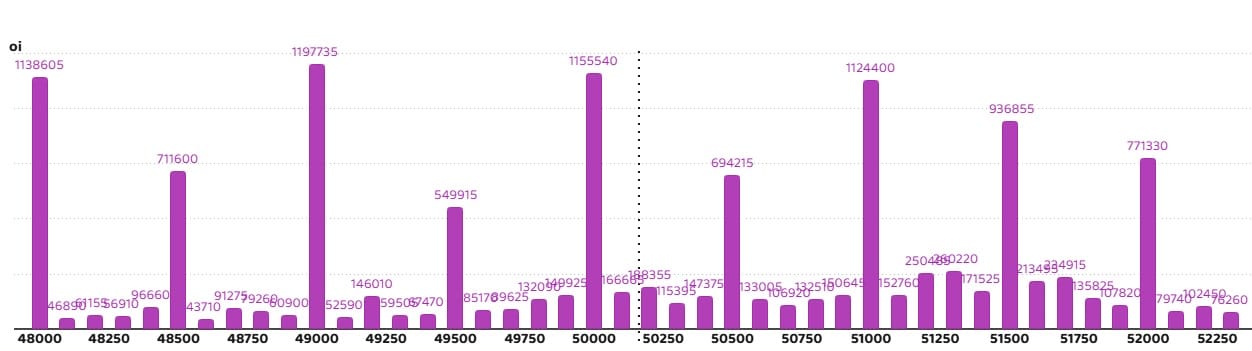
6) Bank Nifty Put Options Data
On the Put side, the 49,000 strike holds the maximum Put open interest (with 11.97 lakh contracts), which can act as a key support level for the index. This was followed by the 50,000 strike (11.55 lakh contracts) and the 48,000 strike (11.38 lakh contracts).
The maximum Put writing was observed at the 48,000 strike (which added 1.61 lakh contracts), followed by the 49,000 strike (77,670 contracts) and the 50,100 strike (65,520 contracts). The maximum Put unwinding was seen at the 49,500 strike, which shed 1.37 lakh contracts, followed by the 51,500 and 50,800 strikes which shed 89,940 and 51,480 contracts, respectively.
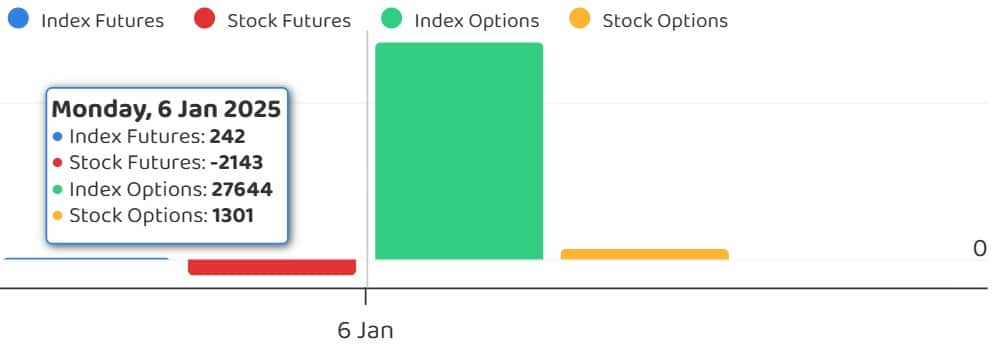
7) Funds Flow (Rs crore)
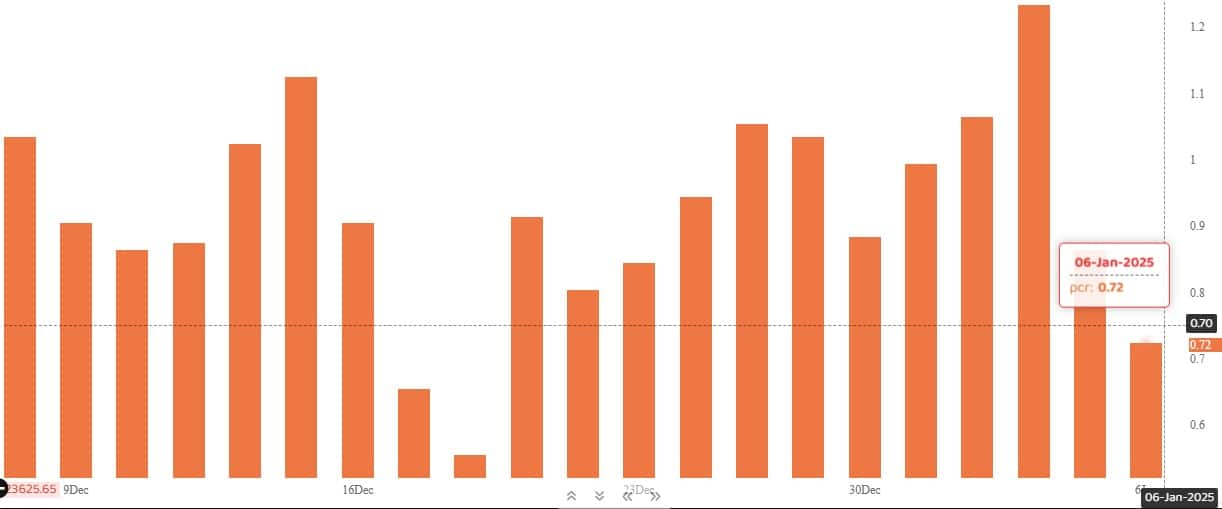
The Nifty Put-Call ratio (PCR), which indicates the mood of the market, fell to 0.72 on January 6, from 0.86 level in the previous session.
The increasing PCR, or being higher than 0.7 or surpassing 1, means traders are selling more Put options than Call options, which generally indicates the firming up of a bullish sentiment in the market. If the ratio falls below 0.7 or moves towards 0.5, then it indicates selling in Calls is higher than selling in Puts, reflecting a bearish mood in the market.
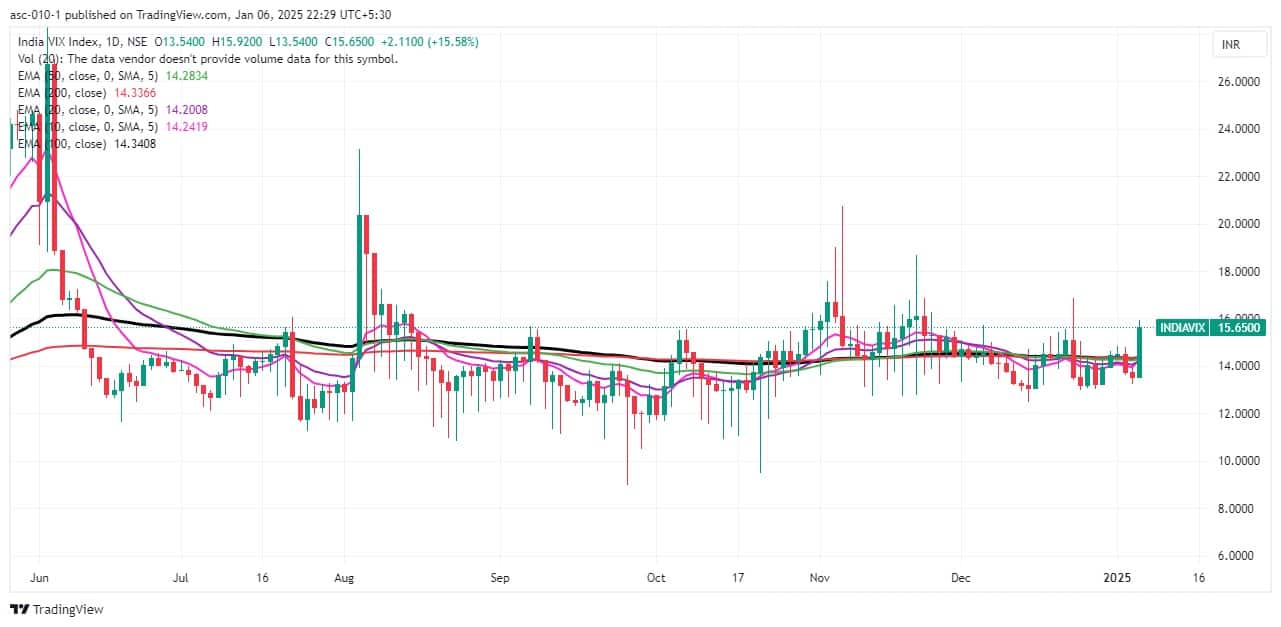
9) India VIX
The India VIX, which measures market volatility, rebounded sharply, rising 15.58% to the 15.65 level, signaling caution for the bulls.
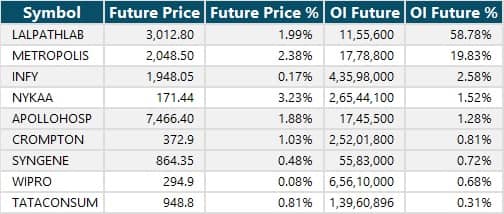
A long build-up was seen in 9 stocks. An increase in open interest (OI) and price indicates a build-up of long positions.
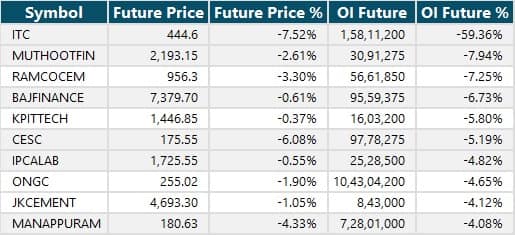
11) Long Unwinding (97 Stocks)
97 stocks saw a decline in open interest (OI) along with a fall in price, indicating long unwinding.
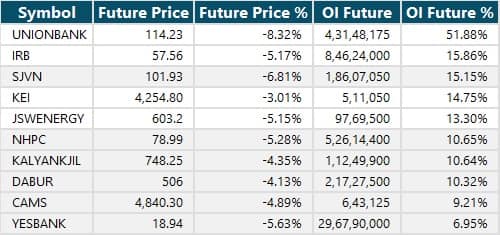
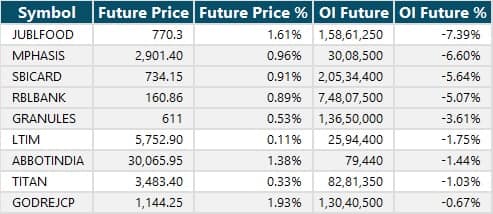
12) Short Build-up (113 Stocks)
113 stocks saw an increase in OI along with a fall in price, indicating a build-up of short positions.
9 stocks saw short-covering, meaning a decrease in OI, along with a price increase.
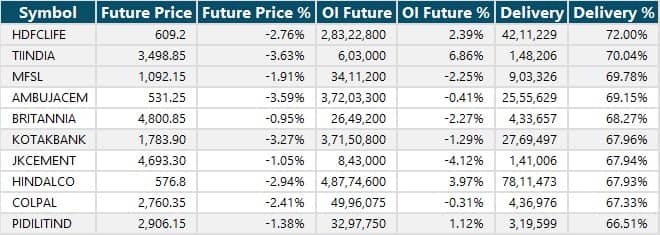
Here are the stocks that saw a high share of delivery trades. A high share of delivery reflects investing (as opposed to trading) interest in a stock.
Securities banned under the F&O segment include companies where derivative contracts cross 95 percent of the market-wide position limit.
Stocks added to F&O ban: Hindustan Copper
Stocks retained in F&O ban: Manappuram Finance, RBL Bank
Stocks removed from F&O ban: Nil
Disclaimer: The views and investment tips expressed by experts on Moneycontrol are their own and not those of the website or its management. Moneycontrol advises users to check with certified experts before taking any investment decisions.
Disclosure: Moneycontrol is a part of the Network18 group. Network18 is controlled by Independent Media Trust, of which Reliance Industries is the sole beneficiary.
Discover the latest Business News, Sensex, and Nifty updates. Obtain Personal Finance insights, tax queries, and expert opinions on Moneycontrol or download the Moneycontrol App to stay updated!
Find the best of Al News in one place, specially curated for you every weekend.
Stay on top of the latest tech trends and biggest startup news.


