


The market was caught in bear trap in truncated week ended April 13 as the Nifty50 erased all its previous week's gains and closed 1.7 percent higher at 17,476, dented by profit-booking and selling pressure amid higher oil prices raising inflation concerns, intensified Ukraine crisis and FII outflow. Traders will also closely watch corporate earnings to get a clear direction.
But the index defended 20-day simple moving average (SMA - 17,471) as well as 20-day exponential moving average (EMA - 17,455), which could act as a support in coming days. If that gets broken, then 17,150 (around 200-DMA and 200-EMA) will be a crucial support for the index.
On the higher side, 17,600-17,700 levels could be the immediate hurdles and if it's breached, the index may move beyond 17,800-17,900 levels, experts feel.
"Now if we take a glance at the daily time frame chart, we can see the Nifty placed at a crucial juncture. Firstly, the sacrosanct support of 20-day EMA is positioned at 17,450 which coincides with the breakout point of previous congestion zone. Hence, till the time Nifty is holding 17,400 – 17,200, we remain a bit hopeful of some recovery here," Sameet Chavan, Chief Analyst-Technical and Derivatives at Angel One, said.
On the upside, he feels 17,700, followed by 17,850, are the levels to watch out for. "If the Nifty has to regain any strength, it needs to surpass these barriers with some authority."
According to him, if the benchmark has to move higher from here, the banks need to take the charge. "The Bank Nifty is placed at its rock-solid support of 37,000–36,800. A move beyond 38,000 would provide the impetus for the next leg of the rally."
Here are top 10 trading ideas by experts for the next 3-4 weeks. Returns are based on the April 13 closing prices:
Expert: Ruchit Jain, Lead Reseach at 5paisa.com
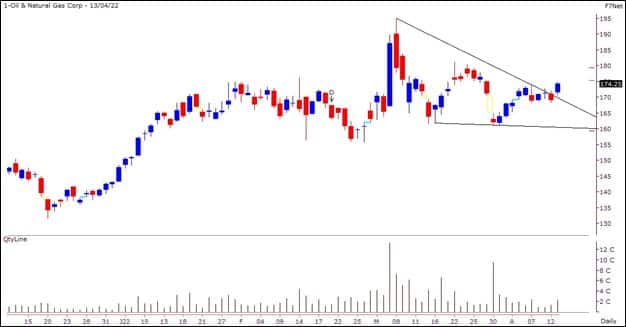
ONGC: Buy | LTP: Rs 174.25 | Stop-Loss: Below Rs 161 | Target: Rs 198 | Return: 14 percent
Amid a run-up in oil prices through the last few months, this stock has been showing a ‘Higher Top Higher Bottom’ formation on the weekly charts indicating an uptrend. In the last one month, the prices have seen some consolidation which just seems to be time-wise correction within an uptrend.
The stock has formed a support base at around Rs 160 and the price structure indicates that the stock could resume its momentum soon.
Hence, traders can look to buy the stock in the range of Rs 174-172 for potential targets of Rs 187 and Rs 198 in the next few weeks. The stop-loss for long positions can be placed below the swing low support of Rs 161.
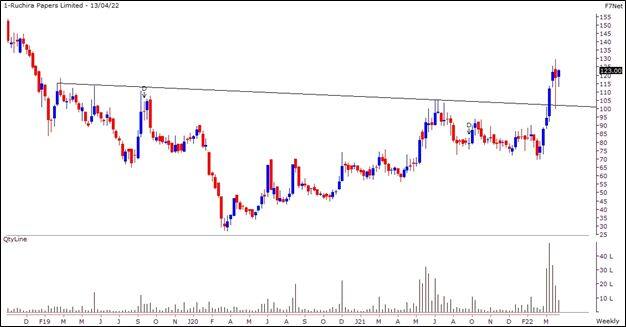
Ruchira Papers: Buy | LTP: Rs 123 | Stop-Loss: Below Rs 113 | Target: Rs 140 | Return: 14 percent
The paper sector stocks have witnessed good buying interest recently and have shown an outperformance in the broader markets. This stock has recently given a breakout from an ‘Inverted Head and Shoulders’ pattern on the weekly charts and post breakout, good volumes have been witnessed.
The momentum continues to remain strong and hence we expect a continuation of the uptrend in the short term.
Short-term traders can look to buy the stock in the range of Rs 123-121 for potential targets of Rs 134 and Rs 140 in the next few weeks. The stop-loss for long positions should be placed below the support of Rs 113.
Expert: Shrikant Chouhan, Head of Equity Research (Retail) at Kotak Securities
Max Financial Services: Buy | LTP: Rs 785.5 | Stop-Loss: Rs 755 | Target: Rs 860 | Return: 9.5 percent
After a medium-term price correction, the stock took the support near Rs 700 and bounced back sharply. After reversal, it is comfortably trading above the 20-day SMA (simple moving average) which is largely positive.
In addition, on weekly charts it has formed promising reversal formation that also supported short-term uptrend. The texture of the charts indicating strong possibility of fresh uptrend rally, if it stands above Rs 755.

Indraprastha Gas: Buy | LTP: Rs 389.9 | Stop-Loss: Rs 375 | Target: Rs 421 | Return: 8 percent
After a long correction eventually the stock took the support near Rs 320 and bounced back sharply. After the correction, the stock witnessed a sharp price-volume rally. From the lowest level, it recovered over 25 percent.
On daily and weekly charts, the stock has seen a higher bottom formation and it is trading near 50 and 20 day SMA.
Unless it is trading below Rs 375, positional traders retain an optimistic stance and look for a target Rs 421. Fresh buying can be considered now and on dips, if any between Rs 390 and Rs 384 levels with a stop-loss below Rs 375.

Expert: Nandish Shah, Senior Derivative & Technical Analyst at HDFC Securities
Genus Power Infrastructures: Buy | LTP: Rs 87.20 | Stop-Loss: Rs 81 | Target: Rs 100 | Return: 15 percent
The stock price has broken out from the symmetrical triangle on weekly charts with higher volumes. Stock price has also closed at all-time high level on the weekly basis.
Primary trend of the stock is positive as it is trading above its all important short term and long term moving averages.
Oscillators like RSI (relative strength index) and MFI (money flow index) are placed above 60 and rising upwards, indicating strength in the current uptrend of the stock.

Control Print: Buy | LTP: Rs 434.3 | Stop-Loss: Rs 400 | Target: Rs 500 | Return: 15 percent
The stock price has broken out from the downward sloping trendline on daily chart, adjoining the highs of January 20, 2022 and March 17, 2022 with higher volumes. Stock price has broken out on the weekly chart where it closed at highest level since May 2018.
It has been taking support at 200 days EMA (exponential moving average) since last few months.
Oscillators like RSI and MFI are placed above 60 and rising upwards, indicating strength in the current uptrend of the stock. Plus DI (directional indicator) is trading above Minus DI while ADX (average directional index) line is placed above 25, indicating momentum in the current uptrend.

Shipping Corporation of India: Buy | LTP: Rs 133.85 | Stop-Loss: Rs 127 | Target: Rs 150 | Return: 12 percent
The stock price has broken out from the symmetrical triangle on the daily chart with higher volumes. Momentum Oscillator like RSI and MFI has witnessed trendline breakout indicates higher possibility of a sharp rise in the prices in the coming days.
Plus DI is trading above Minus DI while ADX line is placed above 25, indicating momentum in the current uptrend.

Expert: Malay Thakkar, Technical Research Associate, GEPL Capital
IIFL Finance: Buy | LTP: Rs 366.95 | Stop-Loss: Rs 330 | Target: Rs 440 | Return: 20 percent
IIFL Finance has been moving in a strong uptrend since March 2020. Currently the stock is breaking out of a 8-month long consolidation with strong volume build-up.
In the current week, the stock formed a Bullish Marubozu candle with the breakout which indicates bullish sentiment in the counter.
The RSI (relative strength index) indicator is also breaking out and confirming the bullish view.
Going ahead, we expect the stock to move higher towards Rs 410 followed by Rs 440 levels. We recommend to follow a strict stop-loss of Rs 330 on daily closing basis.

Godfrey Phillips: Buy | LTP: Rs 1,292.25 | Stop-Loss: Rs 1,185 | Target: Rs 1,550 | Return: 20 percent
On long term charts, Godfrey Phillips has taken support at the rising trendline and bounced to give a close at 4-month high.
On the daily charts, the stock has broken out of an Inverse Head & Shoulder pattern with strong volumes indicating strength in the breakout.
The stock has formed a long bullish Marubozu candle on the weekly charts and has broken and sustained above the 20-week SMA (Rs 1,118).
The RSI indicator on daily has also given a breakout and confirmed the bullish view.
Price action and technical parameters indicate prices moving higher towards Rs 1,425 followed by Rs 1,550 levels. We recommend a stop-loss of Rs 1,185 for this trade setup.

Thermax: Buy | LTP: Rs 2,229.85 | Stop-Loss: Rs 2,050 | Target: Rs 2,550 | Return: 14 percent
Thermax has been moving in a rational uptrend with higher highs and higher lows formation. Recently the stock took support at its 20 Day SMA (Rs 2,009) and broke out of a 3 months consolidation backed with good volumes.
The RSI indicator also crossed above the 60 mark and is confirming the breakout. We expect the stock to outperform and move higher towards Rs 2,400 followed by Rs 2,550 levels.
We recommend a stop-loss of Rs 2,050 for this trade.

Discover the latest Business News, Sensex, and Nifty updates. Obtain Personal Finance insights, tax queries, and expert opinions on Moneycontrol or download the Moneycontrol App to stay updated!
Find the best of Al News in one place, specially curated for you every weekend.
Stay on top of the latest tech trends and biggest startup news.


