


The market hit a new high last Friday, the day after the interim budget, but profit-booking seeped in at higher levels, leading to a seven-tenth of a percent gains at close and formation of a 'shooting star' as well as 'double top' kind of bearish reversal candlestick pattern on the daily charts, which raised a bit of concern for further rally.
Hence, a decisive close below 21,800, the low of 'shooting star' candle, can bring more correction in the Nifty 50 and the index will remain in a consolidation mode as long as it stays below 22,100, experts said, adding that the index is likely to take support at the 21,500 level.
For the week ended February 2, the index gained 2.35 percent to settle at 21,854.
"Pricewise, it may seem that bulls had an upper hand in the eventful week, however, Friday's notable profit-booking in the latter half, indicates some uncertainty at higher levels," Sameet Chavan, head of research – technical derivatives at Angel One, said.
He said the formation of a shooting star pattern at a new all-time high has a negative implication once prices start trading below the low of the candle i.e. 21,805 and certainly casts doubt on bullish prospects.
Hence, he advised traders to avoid complacent long bets and ideally any bounce towards 22,000 - 22,100 should be considered to exit long positions. "The primary up-trend will resume only once Nifty closes above 22,100 comfortably," he said.
According to Jigar Patel, senior manager - equity research at Anand Rathi, the new high of the Nifty is a double top, and a close above the level of 22,126 in February could trigger a fresh round of rally. On the downside, 21,500 could be a zone of staggered buying next week, he said.
Moneycontrol collated a list of top 10 stock ideas from experts, with 3-4 weeks perspective. The closing price of February 2 is considered for stock return calculation.
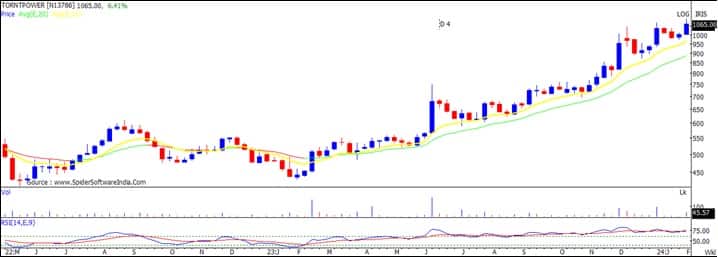
The attached weekly timeframe chart of Torrent Power indicates a sustainable uptrend over the last many months. The stock price has moved up as per the bullish chart pattern like higher tops and bottoms on the weekly timeframe chart. The support of weekly 10 period EMA (exponential moving average) is intact and the stock price has moved up by taking support of this moving average over the period of time.
The volume has started to expand during upside breakout in the stock price and daily RSI (relative strength index) has started to move above the crucial upper 60 levels. The overall chart pattern of Torrent Power Ltd indicates long trading opportunity.
Buying can be initiated in Torrent Power at CMP (Rs 1,064), add more on dips down to Rs 1,030, wait for the upside target of Rs 1,175 in the next 3-5 weeks. Place a stop-loss of Rs 995.
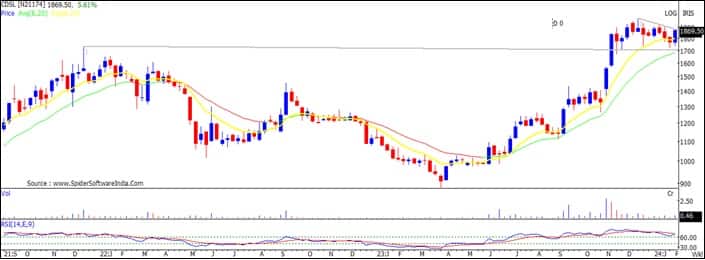
The weekly timeframe chart of CDSL (Central Depository Services) indicates an upside bounce in the stock price after the downward correction of the last 5-6 weeks. We observe an intermediate uptrend in the stock price over the last many months. The stock prices have moved up as per the bullish chart pattern like higher tops and bottoms.
The last week’s swing low at Rs 1,717 could be considered as a new higher bottom at the support of change in polarity. This is positive indication. The weekly RSI has turned up from near upper 60 levels and volume pattern also showing positive outlook for the stock price ahead.
The overall chart pattern of CDSL indicates long trading opportunity.
One may look to buy CDSL at CMP (Rs 1,874), add more on dips down to Rs 1,800 and wait for the upside target of Rs 2,060 in the next 3-5 weeks. Place a stop-loss of Rs 1,725.
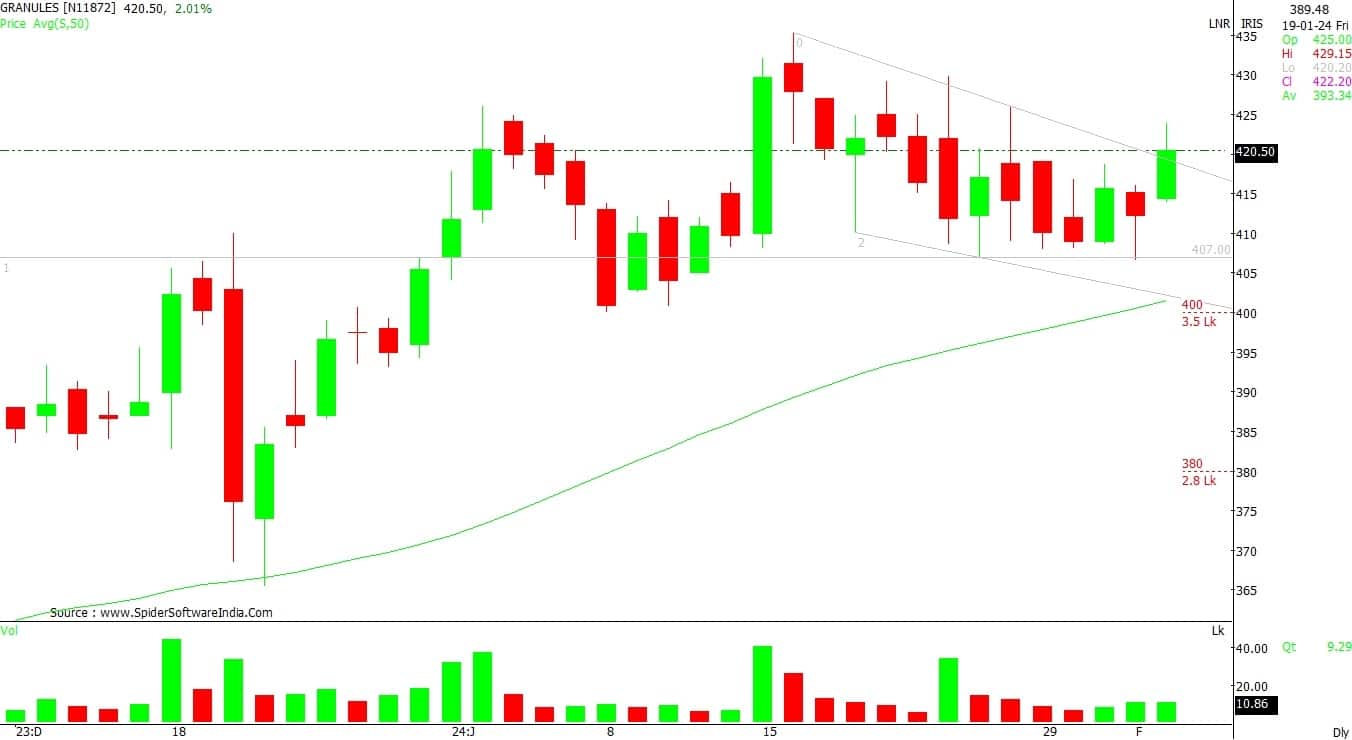
Post its declining trend from the higher levels, the counter is in the consolidation mode where it is trading in a rectangle formation. However, recent bullish activity near the demand zone is indicating good strength.
The gradual up moves in the counter suggest at a fresh leg of bullish trend in the near term.
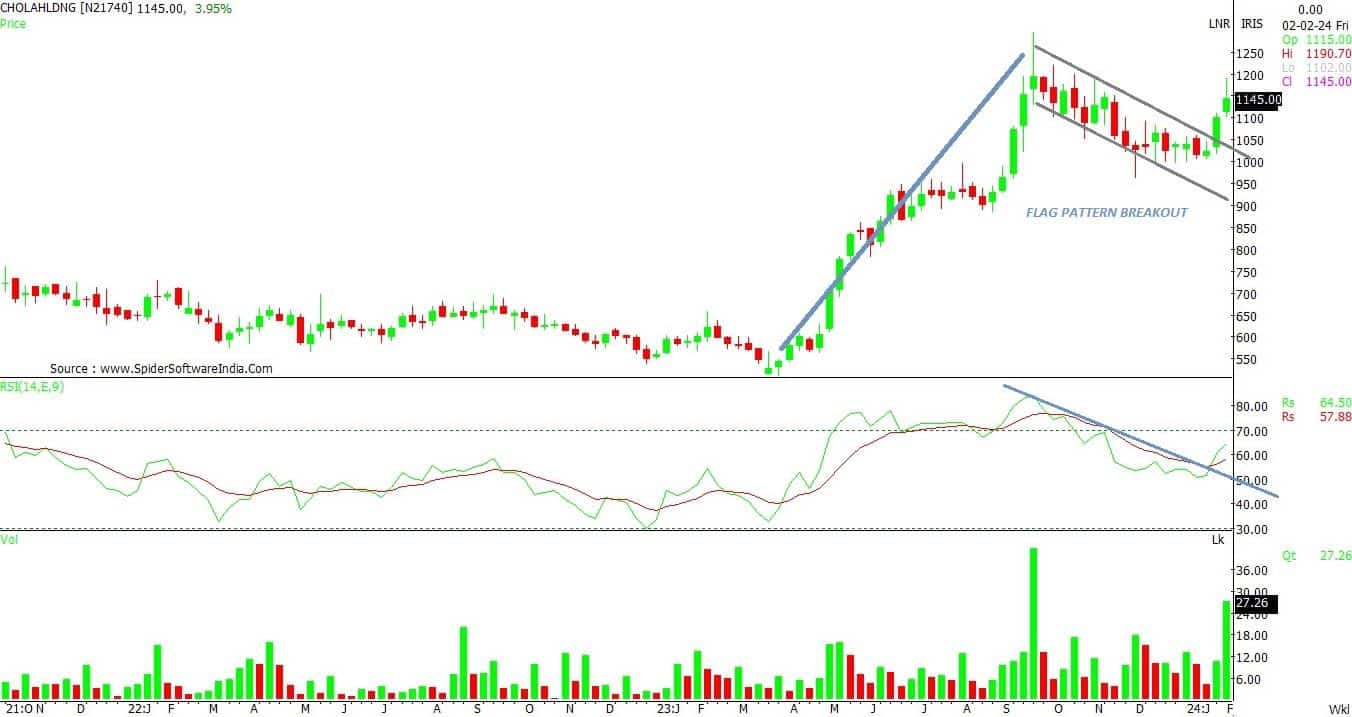
On the weekly time frame, after the sharp up move, the stock was into a consolidation phase and finally, it has given a breakout from its Flag chart pattern. Moreover, the incremental volume activity is indicating further up move in the coming horizon.
Post decline from the higher levels, the counter rebounded from its demand zone and witnessed a steady recovery from the lower levels. Additionally, on the daily charts, the counter has given a breakout from its sloping channel formation.
The up moves in the counter suggest a new leg of bullish trend from the current levels.
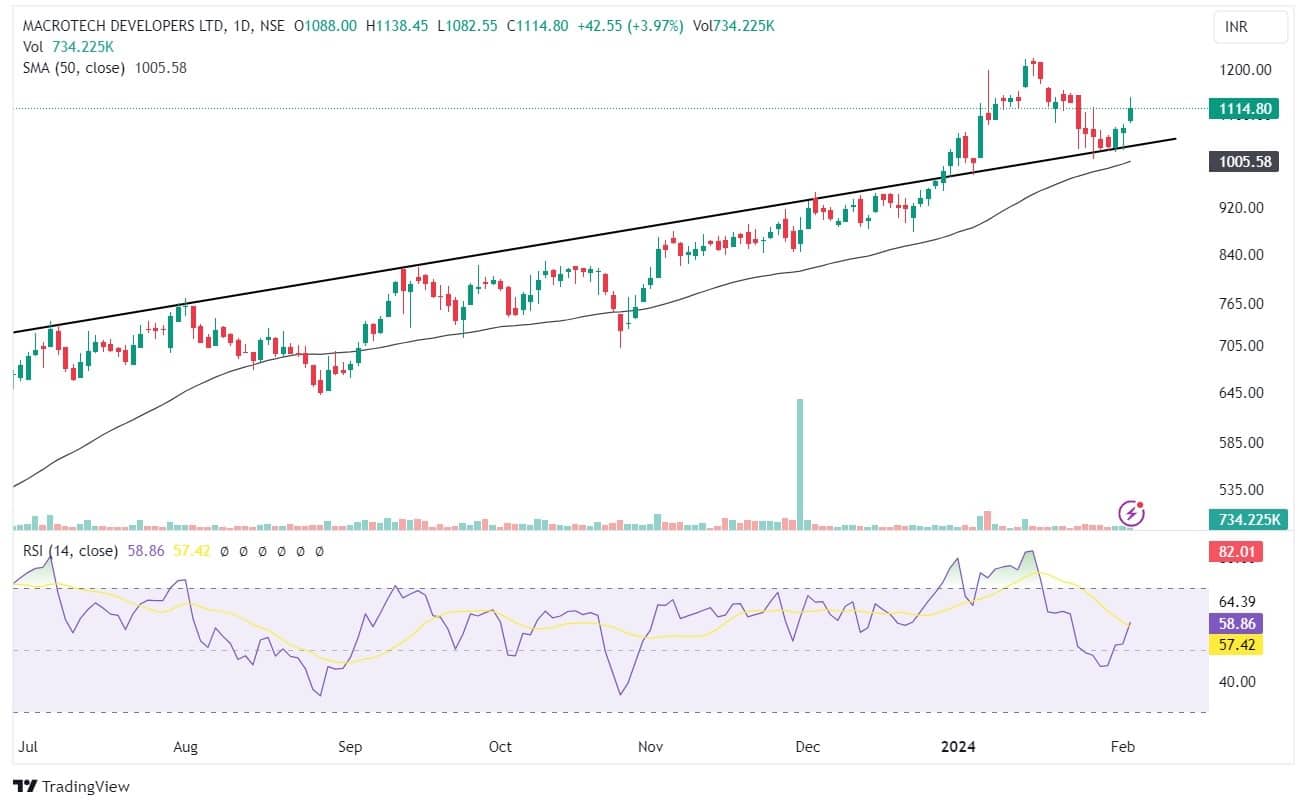
The shares of Macrotech Developers (Lodha) trading at Rs 1,115 exhibits a robust uptrend, recently hitting a new record high (Rs 1,226). Stock took a breather and retraced back towards its previous swing low on relatively lower volumes.
The stock remains steady near its previous swing low (Rs 1,045) where the 50 EMA (exponential moving average) remains intact, indicating that the trend is bullish. A positive crossover in the stochastic daily indicator enhances the bullish outlook.
We anticipate that the stock to scale higher once again towards Rs 1,240 levels. Stop-loss can be kept at Rs 1,055.
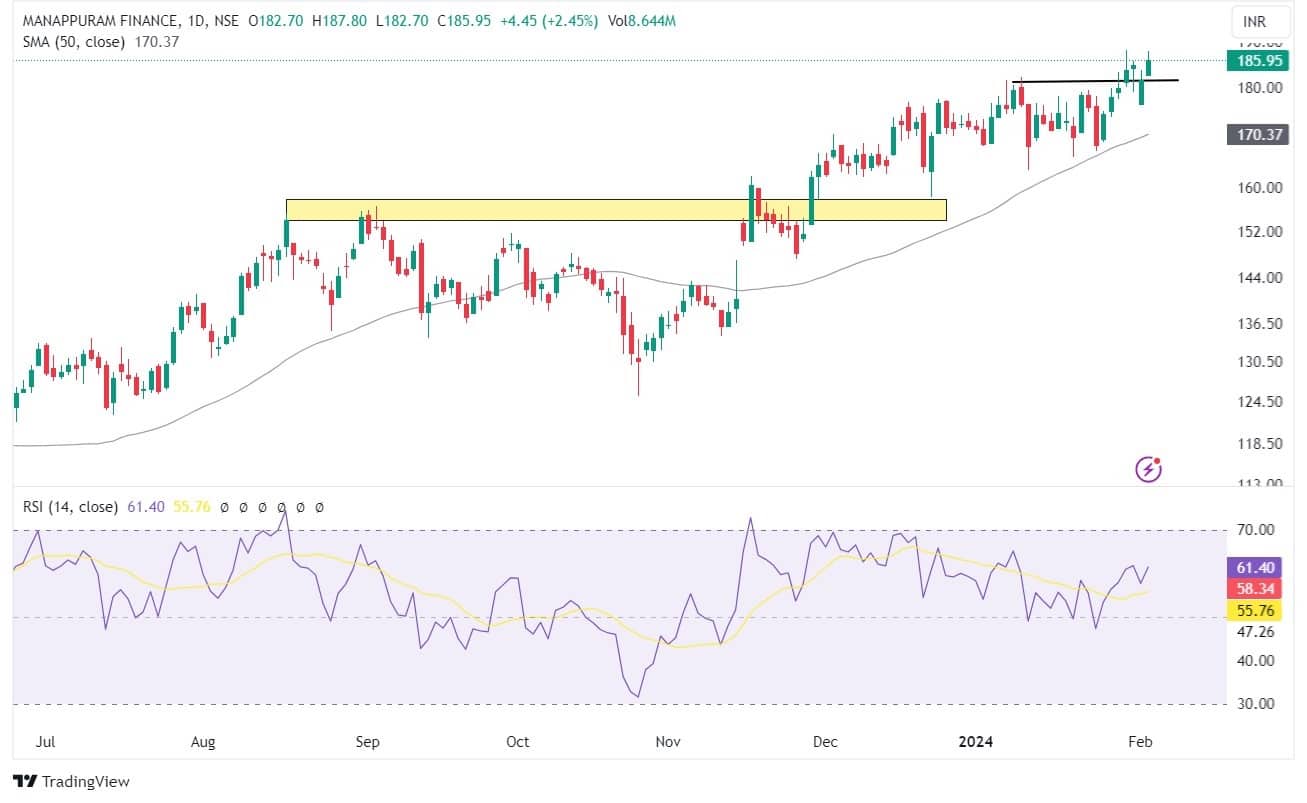
On the daily chart, the stock of Manappuram Finance Ltd is moving in a higher high and higher low formation. Sustaining above a previously observed resistance line signals a confirmed bullish trend. The stock's ascent is accompanied by robust volume indicating strength in price action. Stock is trading above 20 and 50 DMA. Additionally, a bullish weekly candlestick adds credence to the potential for continued upward momentum.
Hence, based on the above technical structure, one can initiate a long position at Rs 186, for the target price of Rs 202. Stop-loss can be kept at Rs 175.
The “Flag Pattern” breakout is steering higher levels, with increasing volumes. This move signals a shift in bullish side. Stability over Rs 1,050 has further attracted the price action to seek for higher levels in the upcoming sessions.
The stock is heading towards Rs 1,250 - 1,300 as the breakout continues to observe accumulation in the range of Rs 1,100 – 1,050.
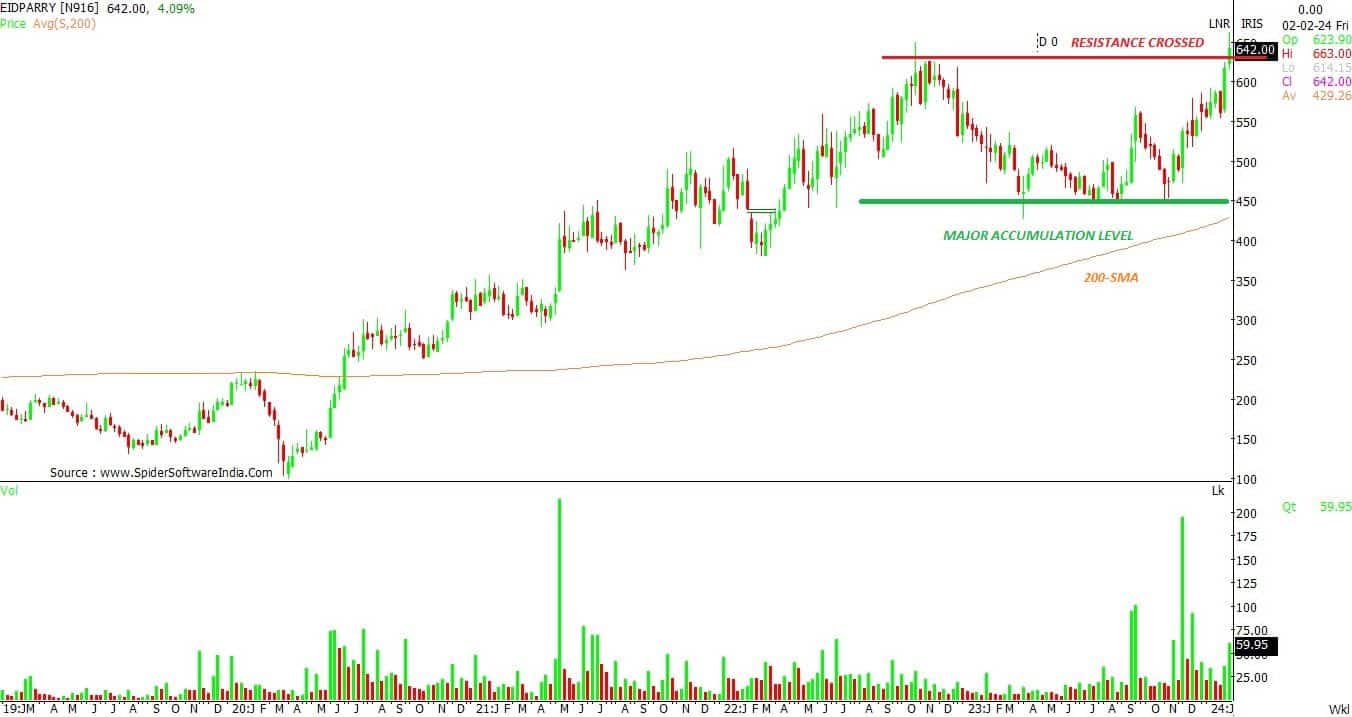
The price action breakout has spurred a fresh upward trend in the shares of EID Parry (India), which may potentially climb towards Rs 720-750 zone. The accumulation witnessed near the support of Rs 450 has resulted in the build-up of long position over Rs 600 mark the weekly chart. Thus, unless a closing basis Rs 600 is taken off, the trend to favour bulls.
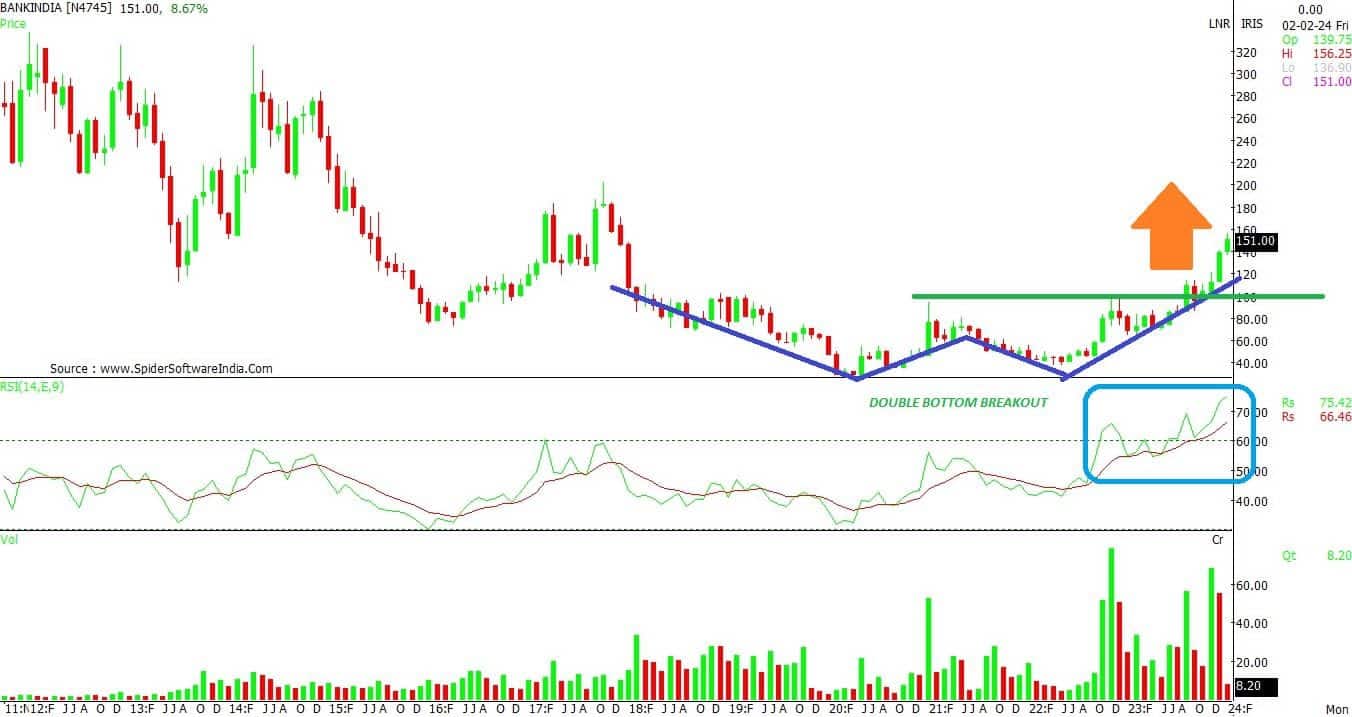
The medium-term position has turned resiliently bullish for shares of Bank of India over Rs 125 levels. The double bottom breakout on the monthly chart has elicited bottom formation in the stock. The breakout is signifying a robust outlook for the coming sessions.
The price action is heading towards Rs 200 – 225 levels, with immediate support appearing at Rs 110-mark. Conservative traders may hunt for buying opportunities in a heathy correction in the range of Rs 135 - 145.
Discover the latest Business News, Sensex, and Nifty updates. Obtain Personal Finance insights, tax queries, and expert opinions on Moneycontrol or download the Moneycontrol App to stay updated!
Find the best of Al News in one place, specially curated for you every weekend.
Stay on top of the latest tech trends and biggest startup news.


