


Continuing with the two candlestick patterns, in this session, we will discuss Bullish Harami and Bearish Harami.
Harami is a reversal candlestick pattern and consists of two candlesticks. The first candle is usually long and the second candle has a small body. The second candle is generally opposite in colour to the first candle.
On the appearance of the Harami pattern, a trend reversal is possible. There are two types of Harami patterns – Bullish Harami and Bearish Harami.
Bullish HaramiBullish Harami pattern is formed at the bottom of a downtrend or near a significant support zone. This pattern is made up of two candlesticks. On day one long bearish candlestick is formed while on day two a small bullish candle is formed.
The size and location of the bullish candlestick formed on day two will tell more about the magnitude of this pattern. The bigger bearish candle of day one and a comparably small bullish candle of Day two represent a strong trend reversal.
Similarly, if the bullish candle formed on day two is located near the bottom of the bearish candlestick formed on day one then one can say the uptrend may be slow, but if it lies in the mid or near the top side of the bearish candle then one can say the reversal is moderate to strong.

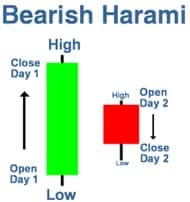
A Bearish Harami occurs when there is a large bullish green candle on day one followed by a smaller bearish candle on day two. The most important aspect of the Bearish Harami is that prices gap down on day two and are unable to move higher back to the close of day one.
The Bearish Harami pattern appears at the top end of an uptrend which gives the trader an opportunity to initiate a short trade.
Disclaimer: The author is Associate Vice President, Analyst-Derivatives at Motilal Oswal Financial Services. The views and investment tips expressed by investment experts on Moneycontrol are their own, and not that of the website or its management. Moneycontrol advises users to check with certified experts before taking any investment decisions.

Discover the latest Business News, Sensex, and Nifty updates. Obtain Personal Finance insights, tax queries, and expert opinions on Moneycontrol or download the Moneycontrol App to stay updated!
Find the best of Al News in one place, specially curated for you every weekend.
Stay on top of the latest tech trends and biggest startup news.


