


The US Federal Reserve at its meeting on December 18, cut the key lending rate by 25 basis points, as was expected by the market. Following the announcement, all eyes were on the US Fed’s dot plot to look for signals on the next rate cut.
The dot plot indicated that the Federal Reserve will undertake a shallower rate cut trajectory of 50 basis points, indicating two rate cuts in 2025, as against its previous forecast of four cuts or a 100 bps reduction next year.
Through this explainer, we decode the Fed dot plot and how it reveals what the Federal Reserve policymakers think about future interest rates.
What is a dot plot?The dot plot is a graph that indicates how many times a particular value occurs, using dots. The scale of the chart is fairly simple and used to represent small sets of data.
Fed policy aimed at boosting growth; bullish on India cyclicals: Pinetree’s Ritesh JainWhat is the Fed dot plot?The Federal Reserve’s dot plot indicates what the members of the Federal Open Market Committee (FOMC) believe should be the appropriate interest rate over various time periods. It is available in the ‘Summary of Economic Projections’ that is released after every Fed meeting.
There are 19 members in the FOMC now. So, the chart represents the views of all 19 members, including that of Federal Reserve Chairman Jerome Powell. However, the views are kept completely anonymous.
Comparing the dot plots over the FOMC policy meetings helps analysts understand how the Federal Reserve’s thinking is shifting over time.
How does one read the Fed’s dot plot? The X-axis of the chart is the time period, while the Y-axis is the federal funds rate, commonly known as the interest rate. Each dot is placed in the mid-point between what every official believes should be the range of federal funds rate.
The above chart indicates that one FOMC member assumes that the key lending rate should be between 4.5 percent and 4.25 percent. Three members believe that the rates should be in the range of 4.25-4 percent, while nine feel they should be slashed to the around 3.75-4 percent. On the other hand, three members are penciling rates in a range of 3.5 percent to 3.75 percent and one member each votes for rates to be in the range of 3.25-3.5 percent and 3-3.25 percent in 2025.
It can be understood that 12 out of the 19 officials assume that rates should be cut at least once next year while five assume more than two rate cuts.
Also Read | Fed policy in line with expectation, but Indian shares may plunge if US bonds spikeWhat do we infer from the dot plot?Since the highest number of Fed officials believe the lending rate should be around 50 basis points lower, the markets are pricing in two more rate cuts through 2025. For context, the Fed has also reduced policy rates by a cumulative 100 basis points in the last three meetings this year.
Why 25 basis points?In the past two meetings the rates were reduced by a quantum of 25 bps each and therefore, the market are expecting a similar trajectory going ahead as well. The view also aligns with the cautious stance taken by the Fed as it anticipates a slowdown in policy easing. Given that inflation, despite its sharp downturn from a 40-year high in mid-2022, is still stubbornly above the Fed's target of 2 percent and growth in the US economy is holding up well, market feels the Fed will be wary of big cuts in interest rates.
How useful is the Fed’s dot plot?The dot plot was created to give investors, economists and experts 'aggressive forward guidance'. However, despite attempting to guide economic activity, the dot plot isn't always an effective tool.
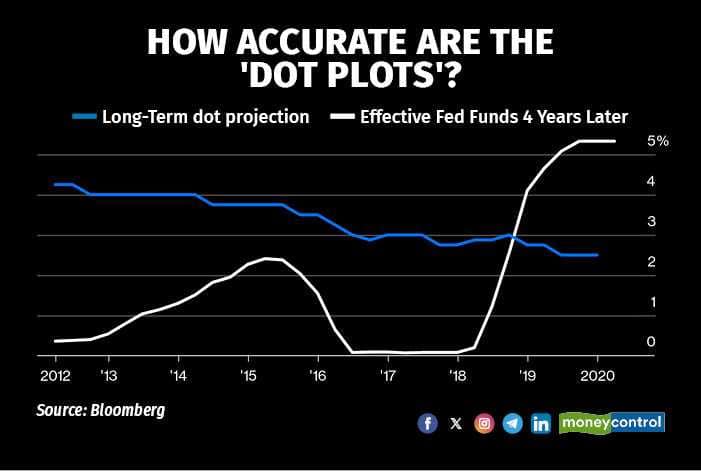
During the December 2021 meeting, the Federal Reserve's dot plot indicated that the interest rate would hover on 0.75 percent to 1 percent by the end of 2022. However, by the end of the year, rates surged to 4.25 percent to 4.5 percent.
Even the Federal governor isn't too fond of the dot plots. He once remarked, "If you are too focused on a few dots, you may miss the larger picture,” he said.
Disclaimer: The views and investment tips expressed by investment experts on Moneycontrol.com are their own and not those of the website or its management. Moneycontrol.com advises users to check with certified experts before taking any investment decisions.Discover the latest Business News, Sensex, and Nifty updates. Obtain Personal Finance insights, tax queries, and expert opinions on Moneycontrol or download the Moneycontrol App to stay updated!
Find the best of Al News in one place, specially curated for you every weekend.
Stay on top of the latest tech trends and biggest startup news.


