


As a new trader entering the stock market, you've likely formulated a trading strategy. However, having an idea alone isn't sufficient to initiate trading based on your strategy. There needs to be a way to validate it before investing money. This is known as backtesting. Both expert traders and algorithmic traders increasingly employ backtesting before implementing their strategies.
Backtesting serves as an analytical tool used by traders to assess the viability and effectiveness of their trading strategies. It involves testing a strategy with historical market data to evaluate how it would have performed in the past. This process provides insights into a strategy's strengths, weaknesses, and potential risks before implementing it in real-time.
When trading leveraged instruments like futures and options, understanding the risks, rewards, and everything in between that your strategy involves is crucial.
Aryaman Singh Parmar of Algotest.in explains backtesting, "Suppose I have a strategy with specific entry and exit times, along with predetermined stop-loss conditions. I can assess its effectiveness by consistently applying it to a particular financial instrument, such as the Nifty 50 Futures contracts starting from 2019. The approach involves simulating this trade, adhering to its predefined conditions on a daily basis (or any desired frequency) from the inception of the available historical data."
"Running a backtest of this strategy will provide us with a lot of information such as profit/loss amount, win and loss percentage, drawdown, and several financial ratios," he added.
Why should a trader backtest a strategy in the first place?
Parmar: Backtesting makes strategy validation easier by allowing traders to see how a strategy would have performed in the past, making it possible to determine the strategy's advantages and disadvantages. It also facilitates thorough risk and drawdown analysis, enabling traders to evaluate the maximum drawdown and related periods, essential for understanding possible risks and assessing a strategy's resilience in challenging market conditions.
Backtesting also provides a platform for innovation by allowing traders to examine past data to draw conclusions. New and potentially more robust trading strategies that can improve decision-making in dynamic market environments are frequently developed as a result of this process.
In a nutshell, backtesting provides a sensible approach to trading as it allows a trader to get the full picture of the strategy they are building, enabling better-informed trading decisions.
What are the key metrics to look out for in a backtest report?
Returns, drawdowns, expectancy ratios, Calmar ratio, win and loss percentage are some of the key metrics to look out for in a backtest report, says Parmar.
Returns
Assessing returns is a critical aspect of backtesting, as they offer a comprehensive view of a trading strategy's profitability. By examining the total returns over the backtesting period, traders can gauge the effectiveness of the strategy in generating profits. Positive returns are indicative of a successful strategy, while negative returns may signal areas for improvement.
Drawdown
Understanding the maximum drawdown is pivotal for risk management. It represents the largest loss from a peak to a trough during the backtesting period.
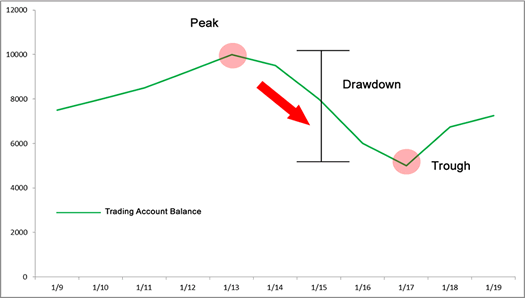
For example, a drawdown of 10% for a strategy with capital requirements of Rs 2 lakh per lot would be Rs 20,000. Essentially, the largest fall in the Profit and Loss curve from the peak is 10 percent or Rs 20,000. This metric provides crucial insights into potential downside risks, helping traders identify the extent of losses the strategy might incur in adverse market conditions.
Expectancy ratio
The expectancy ratio is a metric that indicates the average expected return for each rupee of risk taken. It is calculated using the formula (Average Gain Per Trade/Average Loss Per Trade).
For example, with a ratio of 1.5, a trader anticipates gaining Rs 1.5 on average for every rupee risked in a strategy. This formula provides a quantitative assessment of a trading strategy's potential profitability in relation to its risk exposure.
Drawdown periods
Analysing the duration of drawdown periods adds another layer to risk assessment. It helps traders understand not only the depth of losses but also how long it takes for the strategy to recover from those losses. Shorter drawdown periods indicate a strategy's ability to bounce back quickly, contributing to overall resilience.
Calmar ratio
The Calmar Ratio is a key measure to evaluate a strategy's risk-adjusted performance. It gives insights into the return profile of a strategy with respect to its maximum drawdown. This tells us how effectively a strategy generates returns relative to the risks taken.
It is calculated as the ratio between annual returns and the Maximum Drawdown the strategy exhibits (Return/Max DD) during the backtest period. For example, if a backtest report for a strategy illustrates a return of Rs 1,00,000 and a maximum drawdown of Rs 15,000, the R/MDD or Calmar Ratio is 6.66. A higher Calmar Ratio suggests a more favourable risk-return profile.
Win-loss percentage:
These metrics simply illustrate the number of times the strategy was profitable in a certain backtest period and the number of times it booked a loss. Examining the percentage of winning and losing trades is fundamental in assessing the consistency and effectiveness of a trading strategy.
Let’s now run a simple backtest and analyse these ratios.
We will backtest a simple options trading strategy on the Bank Nifty index between January 2017 and November 2023. The trade details are as follows:
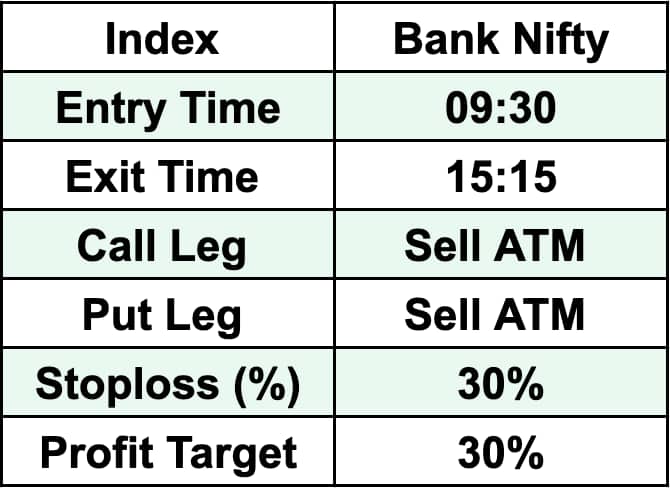
The backtest report is shown below:
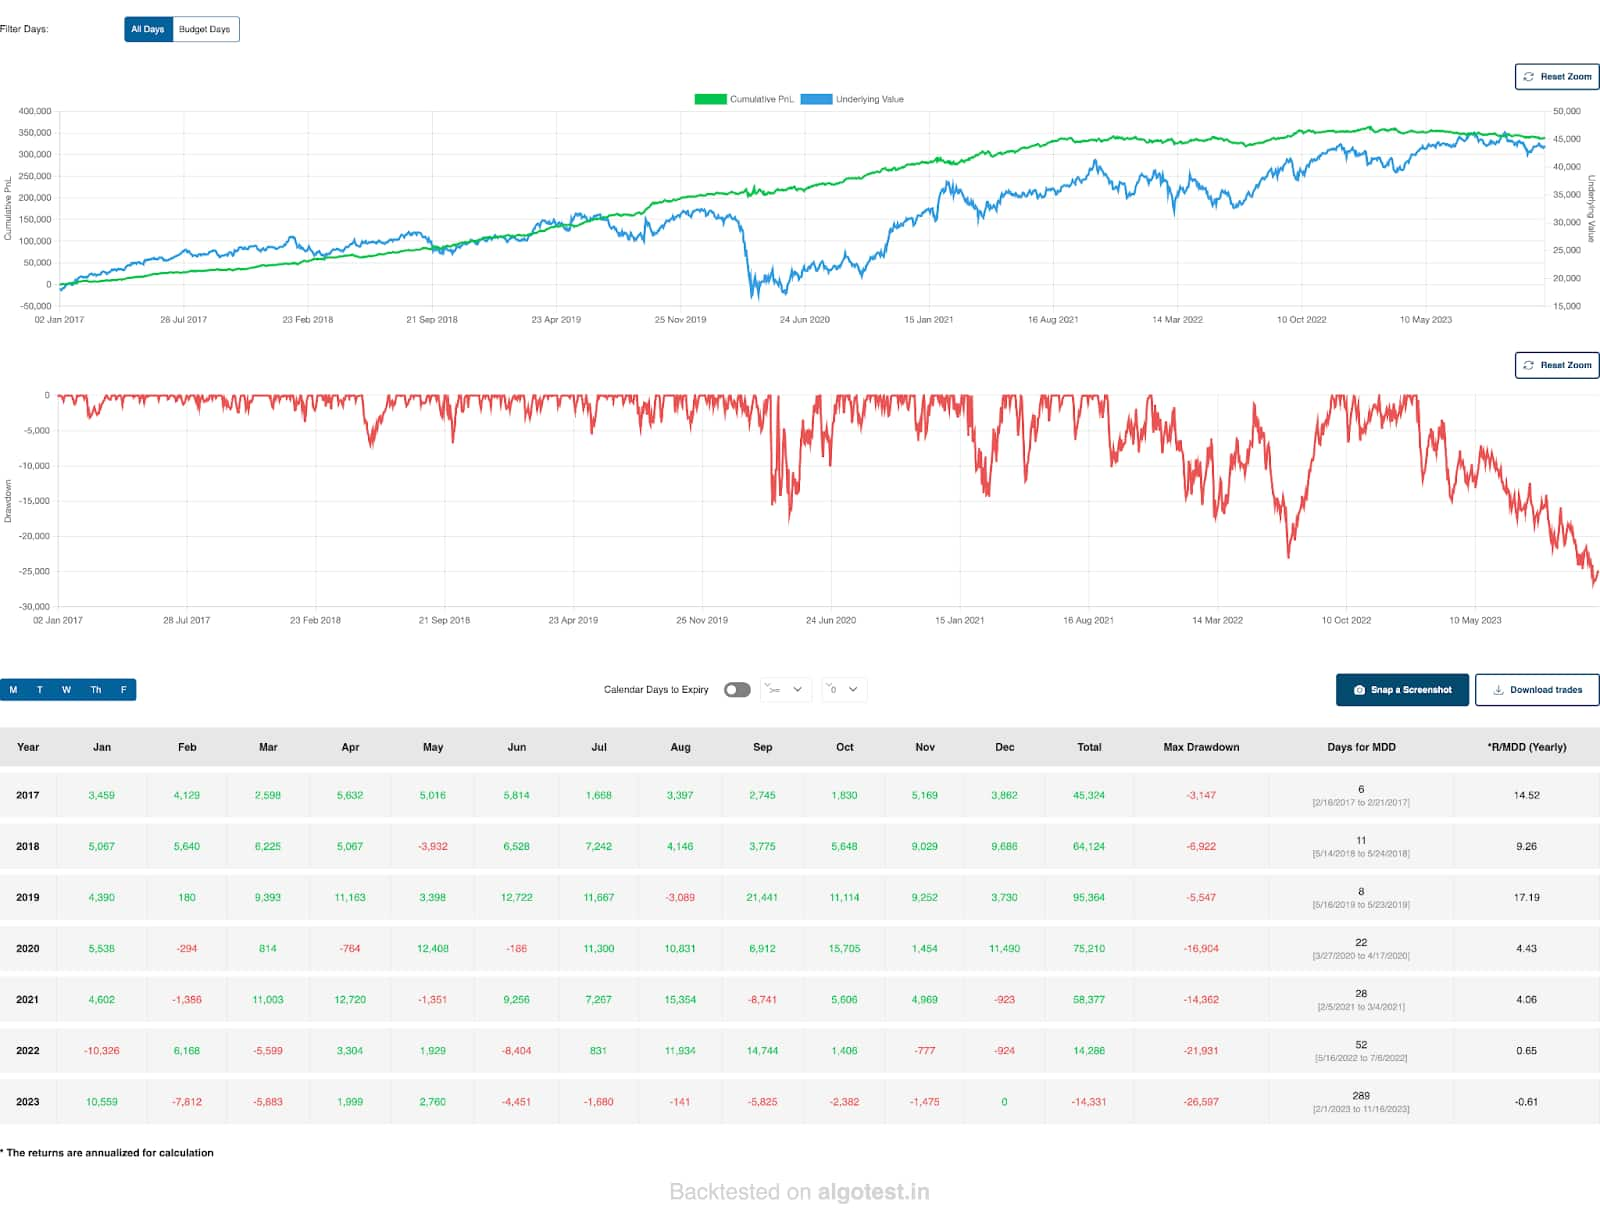 Source: Algotest.in
As you can see, the report is comprehensive, including most of the ratios mentioned earlier, as well as a few other self-explanatory ones.
The strategy has generated a return of Rs 3,38,356 in just under seven years. It also exhibits a win percentage of about 64 percent, a Calmar Ratio (Return/Max DD) of 1.84, and an expectancy ratio of 0.82.
The backtest report is profitable, but is this enough to begin trading with real money? A sensible trader will perform a few more checks and processes to validate the strategy before doing so.
Disclaimer: The views and investment tips expressed by investment experts on Moneycontrol are their own and not those of the website or its management. Moneycontrol advises users to check with certified experts before taking any investment decisions.
Discover the latest Business News, Sensex, and Nifty updates. Obtain Personal Finance insights, tax queries, and expert opinions on Moneycontrol or download the Moneycontrol App to stay updated!


Find the best of Al News in one place, specially curated for you every weekend.
Stay on top of the latest tech trends and biggest startup news.


